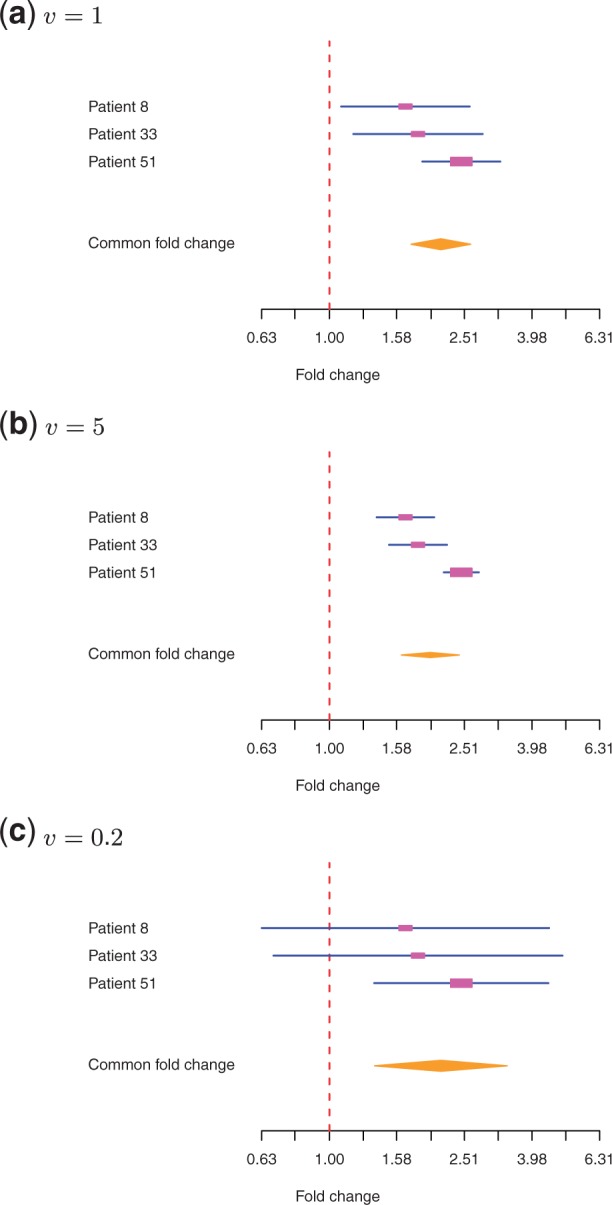
Fig. 4.

Combing evidence from three patients for a gene with rounded, normalized counts of (57, 95), (27, 50) and (55, 135). The forest plots show estimation of individual fold changes and confidence intervals for three models of technical variation: (a) a standard Poisson distribution, (b) an exponentiated Poisson distribution with v = 5, and (c) an exponentiated Poisson distribution with v = 0.2. The lines are confidence intervals. The rectangles indicate the strength of contribution of each sample to the common estimation. The diamond shape represents the common fold change and its confidence interval
