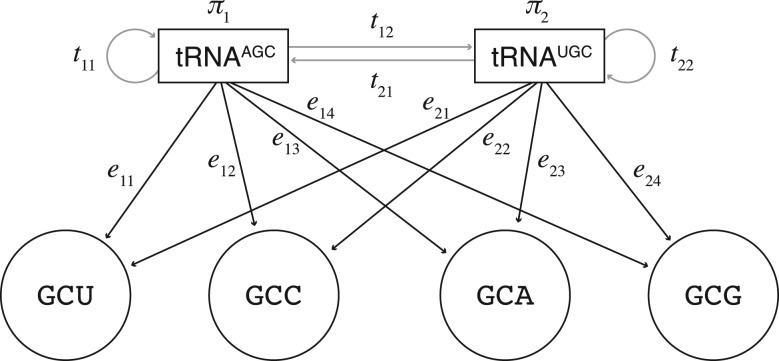
Fig. 3.
HMM for alanine in yeast. The gray arrows represent the transition probabilities t of changing between the unknown tRNA states. Associated with the model are the tRNA starting state probabilities π. The black arrows represent the emission probabilities e of observing the codon given the tRNA states. The transition and start probabilities are estimated from the tRNA abundances and a tRNA reuse parameter. Each model has different emission probabilities derived from the codon reading being evaluated. The model with the highest probability given the sequences is the predicted codon reading

