
Fig. 3.
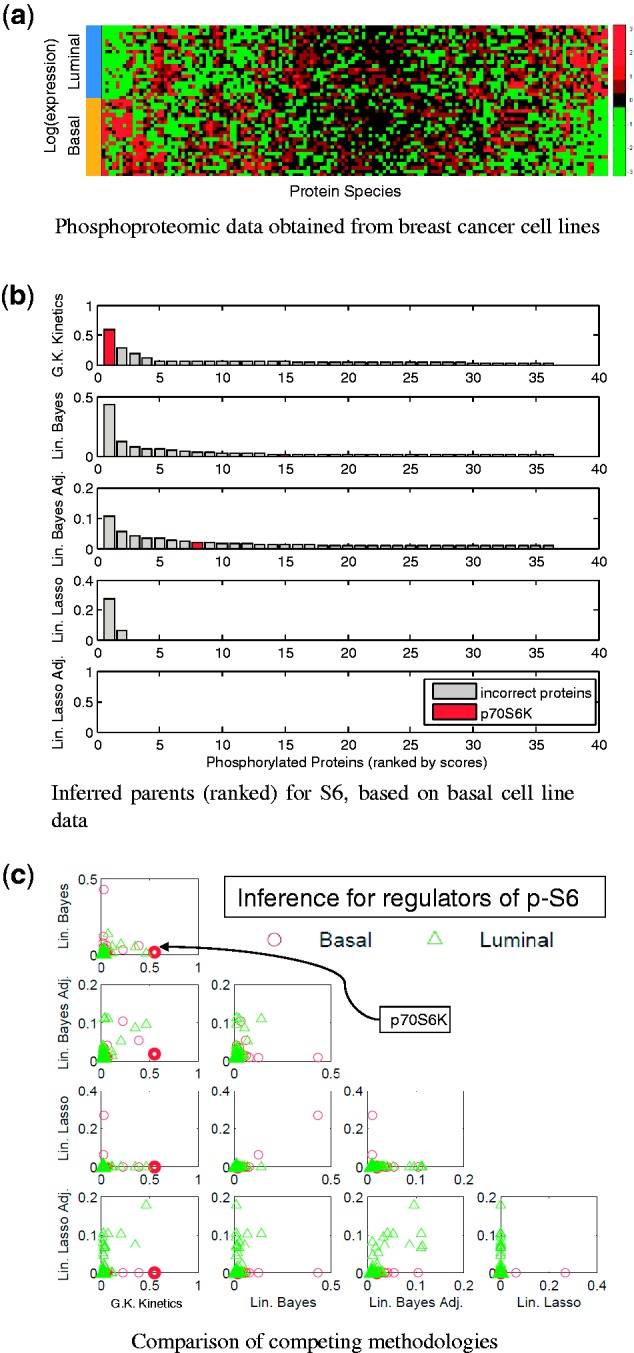
Cancer protein data. (a) Heatmap of reverse-phase protein array data from a panel of breast cancer cell lines. (b) Proteins were ranked as potential regulators of the node S6 under each methodology. The protein p70 S6 Kinase (p70S6K) is known to be a key kinase for the node S6; this known regulator is shown in red in the bar plots. (c) Comparison of methodologies: Each point in the scatter plots represents one phosphoprotein, with the known kinase p70S6K highlighted in bold. [(b) and (c) display weights (posterior probabilities or absolute regression coefficients) assigned to each protein by each method.]