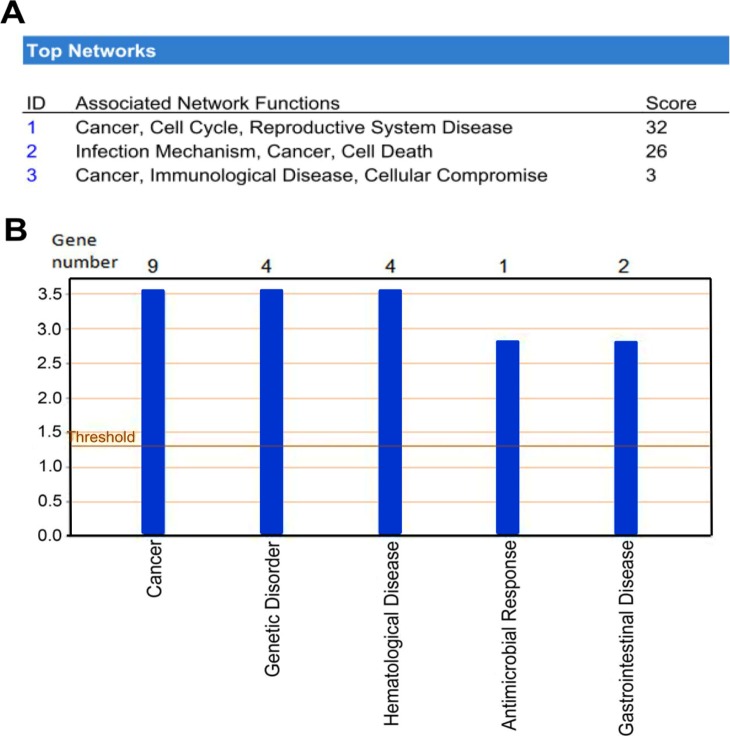
Figure 3. The significance of ANXA4-induced gene expression was analyzed using the Ingenuity Pathway Analysis (IPA) database.
(A) 25 of the 42 candidate genes showed a significant difference in expression (a fold increase of ≥2 or a fold decrease of ≤0.5, P<0.05) and were categorized among the three top-ranked networks. (B) Genes were classified according to their documented/established roles in various disease states and disorders.

