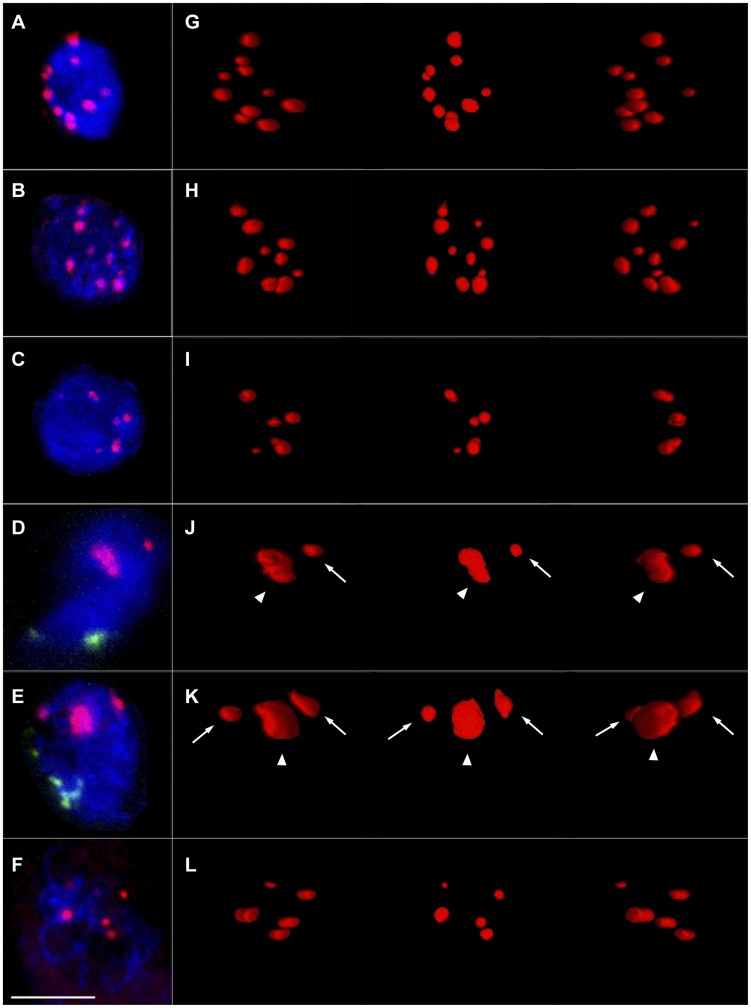
Figure 3. B. distachyon centromere behaviour during early meiosis.
A-F : Confocal maximum projection images of B. distachyon PMC nuclei (DAPI; blue) at different early meiosis stages, labelled with centromeres (A-F; red) and telomeres (D, E; green). Bar = 5 µm. G–L: 3D maximum intensity projection images of centromeres in the corresponding nuclei from A–F. In each image of G–L, −30°, 0° and +30° y axial rotation projection images of the same reconstruction are shown from left to right in sequence. A, G: A typical anther somatic nucleus with 10 normal size and dispersed centromere dots. Centromeres were not associated in anther somatic nuclei at any stages. B, H: A typical pre-meiotic PMC nucleus with 10 normal size and dispersed centromere dots. Centromeres were not associated in most pre-meiotic PMC nuclei. C, I: A late pre-meiotic PMC nucleus with 5 normal size centromere dots, which shows the pairing of centromeres in some late pre-meiotic PMC nuclei that are about to go through meiosis. D, J: A typical leptotene PMC nucleus with one centromere block (J, arrow head) and one normal size centromere dot (J, arrow), which shows that centromeres are clustered at this stage. E, K: A typical zygotene PMC nucleus with one centromere block (K, arrow head) and two normal size centromere dots (K, arrow), which shows that the clustering of centromeres was maintained during this stage. F, L: A typical pachytene PMC nucleus with 5 normal size centromere dots. Centromere clusters were resolved as paired centromeres at this stage.

