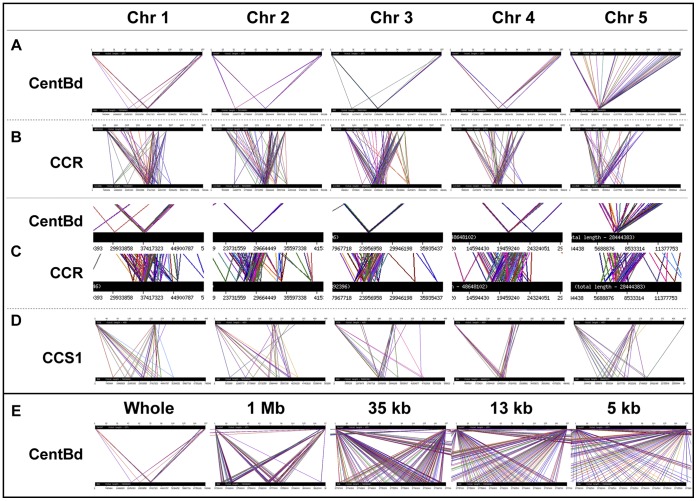
Figure 5. Bioinformatic analysis of B. distachyon centromeric regions.
Centromeric sequences were BLASTed against the assembled B. distachyon genome sequence to show their distribution within the genome. Each small picture shows the BLAST result of one particular centromeric sequence against one particular chromosome. In each small picture, the upper bar represents the full length of the query sequence and the lower bar represents the full length of one chromosome. The left and right borders of one homologous domain are linked by a pair of lines of the same color. A: Distribution of CentBd homologous sequences on each chromosome. CentBd homologous regions were enriched at a few loci on each chromosome, with one major locus per chromosome containing thousands of CentBd homologous regions. B: Distribution of S. bicolor CCR homologous sequences on each chromosome. On each chromosome, CCR homologous sequences were enriched in large numbers at one major locus. C: Magnified images of A and B at the same narrow centromeric region of each chromosome. The CentBd enriched loci were surrounded by an enrichment of CCR homologous sequences. D: Distribution of CCS1 homologous sequences on each chromosome. The CCS1 homologous sequences are comparatively less abundant. CCS1 homologous regions were enriched at the centromeric region of chromosome 3 and 4, but were more dispersed on chromosome 1, 2 and 5. E: Serial magnified pictures of the major CentBd enriched locus of chromosome 1. The major CentBd enriched locus contains two CentBd blocks that are 300 kb from each other. The CentBd blocks are about 100 kb in size and are formed by tandemly arranged CentBd monomers.

