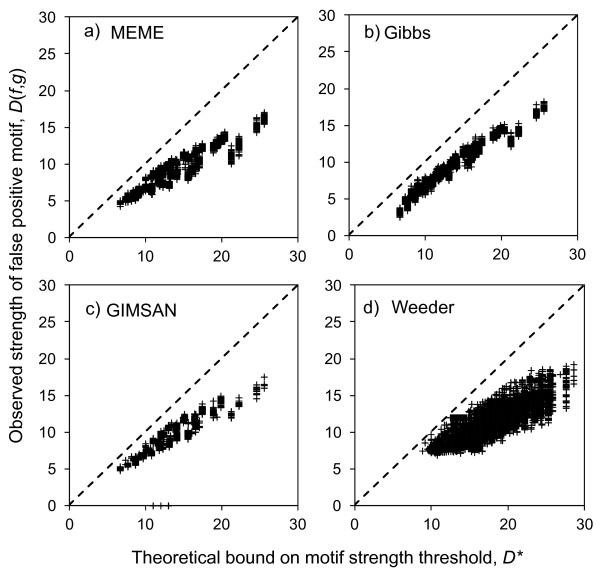
Figure 5.
Comparison of theoretical bound and observed false-positive motif strengths. The strengths of observed false positive motifs identified by a) MEME, b) the Gibbs Sampler, c) GIMSAN and d) Weeder show reasonable accordance with our theoretical bound. Each cross represents one false positive motif, while the dashed line represents ‘y = x’ where the theoretical bound equals the observations. The results include motifs for L = 50,100,500,1000 and n = 10,20,30,50,100. For a), b) and c) the results are for motifs of W = 5, 10 and 15, while for d) the results are for W = 6,8,10 and 12.

