
Figure 3. Microarray analysis of IFN inducible genes in IFN sensitive SKOV3 cells, moderately resistant HT1080 cells treated with IFN, U0126 or both.
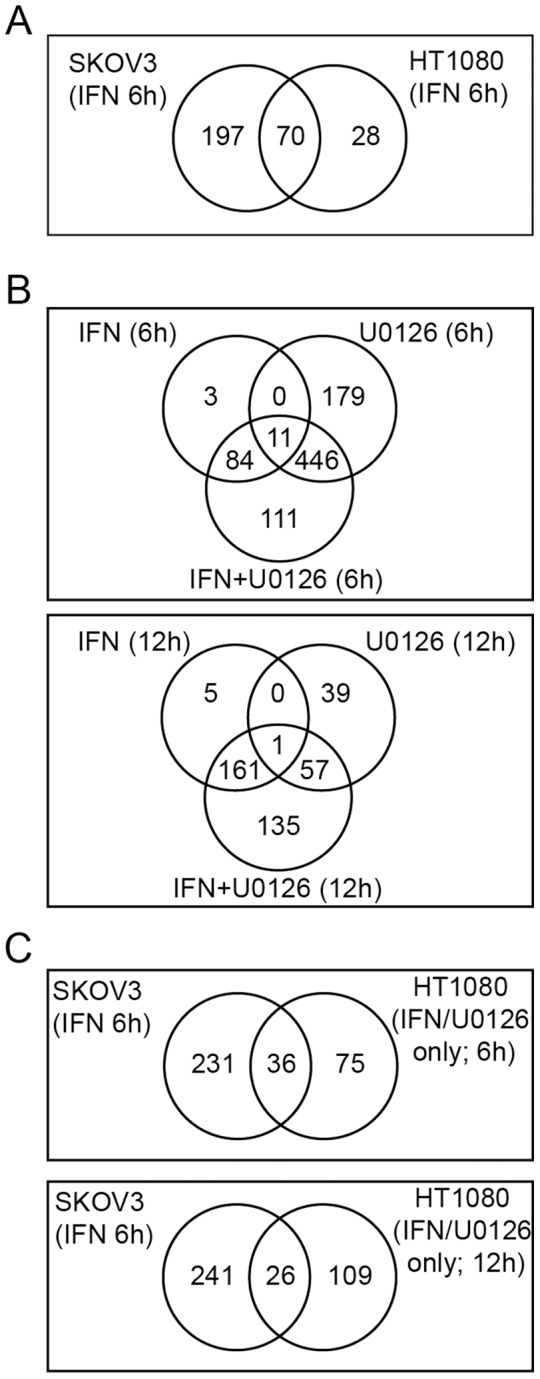
(A) Venn diagrams from DNA microarray analysis showing global suppression of IFN-regulated genes in HT1080 cells compared to SKOV3 cells. Shown are the number of genes significantly upregulated (FDR <0.01) at 6 hours after IFN treatment in the SKOV3 vs. HT1080 cell lines. (B) Venn diagrams showing the number of genes significantly upregulated (FDR <0.01) in HT1080 cells following treatment with IFN, U0126 or both IFN and U0126 for 6 hours or 12 hours as indicated. (C) Venn diagrams comparing genes upregulated by “protective” treatments in each cell type (IFN for SKOV3 cells and IFN/U0126 for HT1080 cells).