
Figure 1.
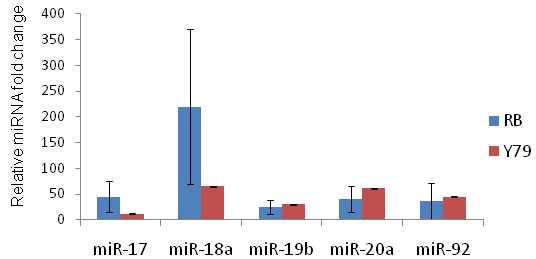
A graph showing the expression of miR 17–92 cluster in primary retinoblastoma (RB) tumors. The blue bars represent RB tumors and the red bars represent Y79 cells. The error bars represent the varying expression of microRNA in 19 tumors.
Official websites use .gov
A
.gov website belongs to an official
government organization in the United States.
Secure .gov websites use HTTPS
A lock (
) or https:// means you've safely
connected to the .gov website. Share sensitive
information only on official, secure websites.
A graph showing the expression of miR 17–92 cluster in primary retinoblastoma (RB) tumors. The blue bars represent RB tumors and the red bars represent Y79 cells. The error bars represent the varying expression of microRNA in 19 tumors.