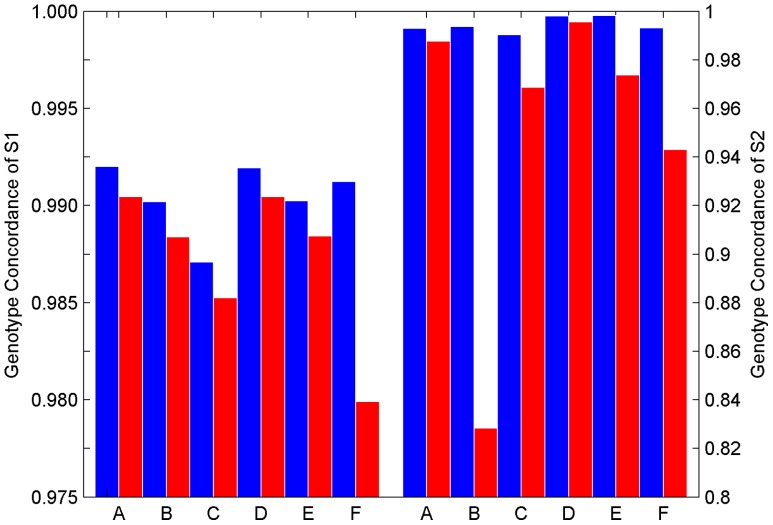
Figure 4. Concordance in genotypes between replicates of the same subject within a genotyping platform and within a genotyping experiment for comparing with (blue bars) and without (red bars) removal of arrays of low quality.
The left panel is plotted for the data from genotyping experiment E1 while the right panel for genotyping experiment E2. The subject codes of the x-axis are listed in Table 1.

