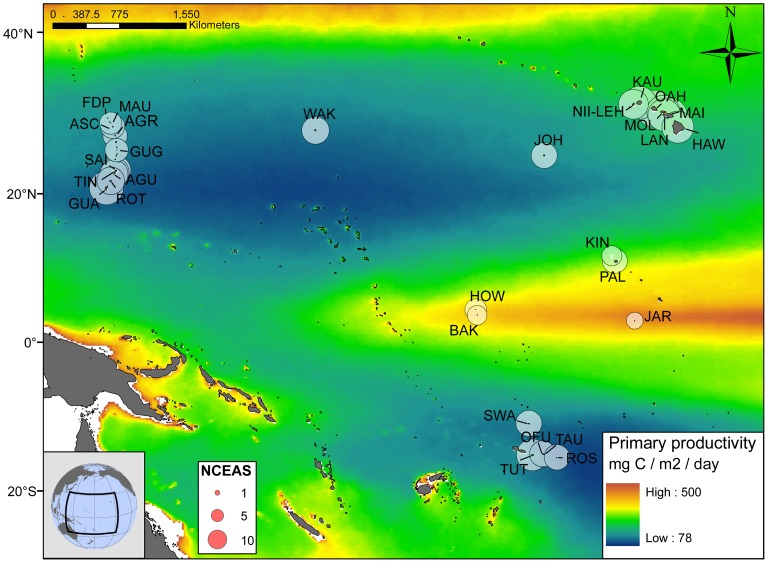
Figure 1. Location of the 29 islands surveyed.
Color scale indicates oceanic net primary production derived from satellite data using the Vertically Generalized Production Model (VGPM). Circles indicate the relative NCEAS cumulative human impact score for each island. For island abbreviations see Table 1.

