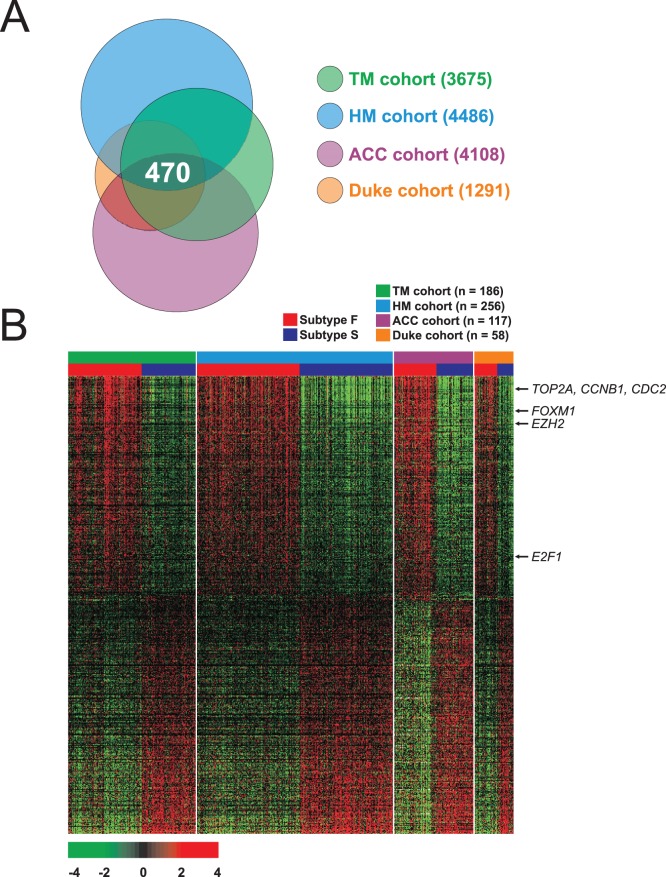
Figure 4. Cross comparison of gene lists from 4 independent cohorts of lung adenocarcinoma patients.
(A) Venn diagram of genes whose expression is significantly different between subgroups F and S. a univariate test (2-sample t-test) with multivariate permutation test (10,000 random permutations) was applied. In each comparison, we applied a cut-off P-value of less than 0.001 to retain genes whose expression was significantly different between the 2 groups of tissues examined. (B) Expression patterns of selected genes shared in 4 lung adenocarcinoma cohorts. The expression of 470 genes is commonly up- or down-regulated in all 4 cohorts. Colored bars at the top of the heat map represent samples as indicated.

