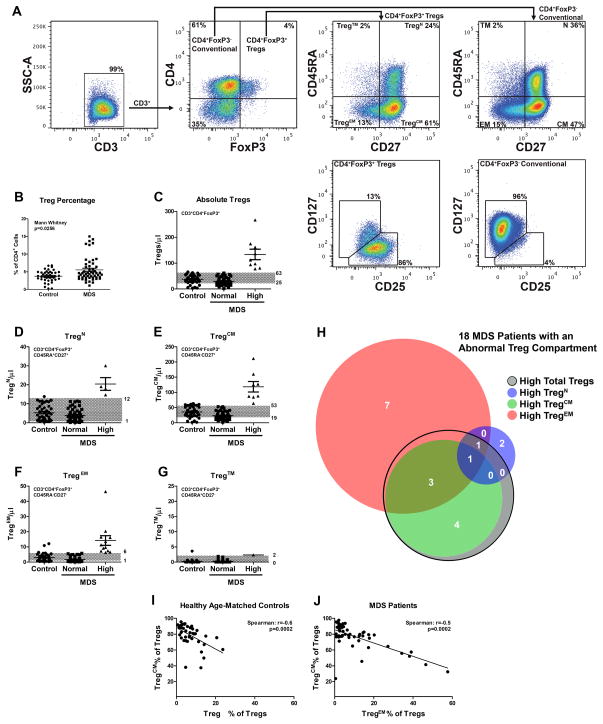
Figure 1. Treg expansion in distinct subsets of lower-risk MDS patients.
(A) Flow cytometry gating schema for defining Treg cells and Treg subsets. Cells were first gated on CD3 expression, and then on CD4 and FoxP3 expression. The resulting Treg (CD4+FoxP3+) or conventional T-cell (CD4+FoxP3−) populations were then analyzed for CD45RA and CD27 expression. Naïve Tregs (TregN) were considered CD45RA+CD27+, central memory Tregs (TregCM) were considered CD45RA−CD27+, and effector memory Tregs (TregEM) were considered CD45RA−CD27−. No significant population of terminal memory Tregs (Treg™) were observed (CD45RA+CD27−). CD4+FoxP3+ Tregs or conventional CD4+ T-cells were then analyzed for CD127 and CD25 expression. (B) Tregs were reported as a percentage of the CD4+ compartment in MDS patients and age-matched controls. (C–G) The normal range of Tregs in peripheral blood was established in age-matched healthy donors. To establish this cutpoint for “normal” versus “high” expression, the mean ± 1 standard deviation (grey areas) was determined based on the ALC. Graphs indicate the data from Control, and MDS patients with Normal and High levels of total Tregs, or of each Treg subtype calculated. (H) A Venn diagram demonstrating the amount of overlap of the 18 MDS patients with high total Treg or high Treg subtype numbers. (I–J) The frequency of TregCM cells negatively correlates with the frequency of TregEM cells within the Treg compartment in age-matched controls (I) and MDS patients (J).

