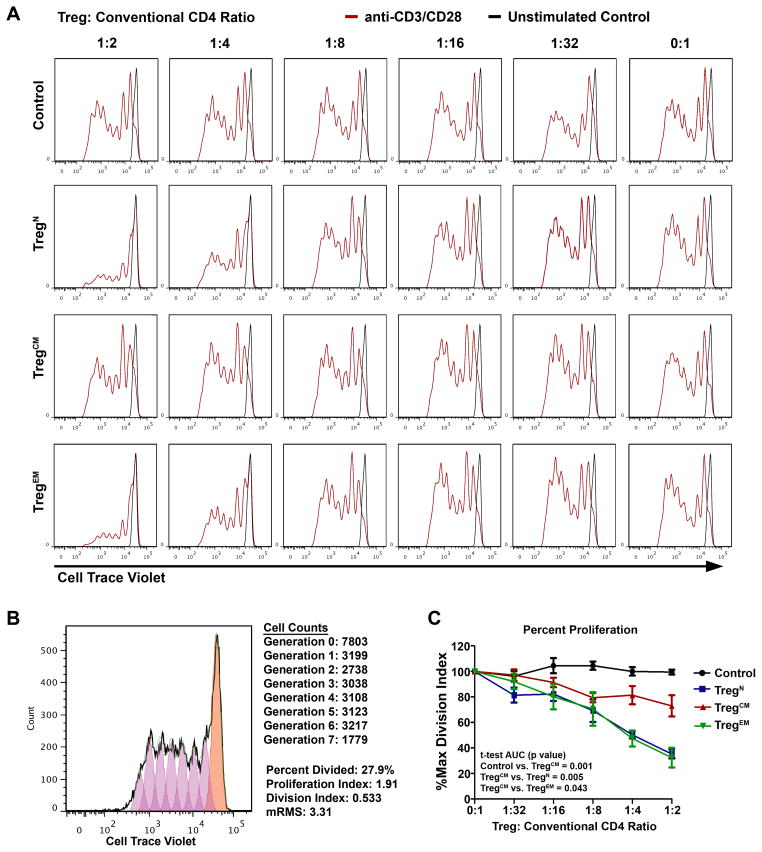
Figure 2. Treg subset suppressive function in vitro.
TregN, TregCM, TregEM, or control CD4+CD25− T-cells were isolated via FACS and plated at increasing ratios with Cell Trace Violet labeled responder CD4+CD25− T-cells over plate-bound anti-CD3 antibody (5 μg/ml), and with soluble anti-CD28 (2 μg/ml). Cells were allowed to proliferate for five days and then Cell Trace Violet dilution was then assessed by flow cytometry (red histograms). Unstimulated responder cells are overlaid as a reference for no cellular division (black histograms). A representative inhibition assay from a healthy donor is shown (A). The amount of proliferation in each assay was quantified using the proliferation algorithm available with FlowJo analysis software, as exemplified (B). Briefly, this analysis fits proliferating cells into estimated generations (non-dividing cells: orange histogram, generation 0; dividing cells: purple histograms, generations >0). The events in each resulting generation are enumerated, and the percentage of original dividing cells from generation 0 is calculated, along with the proliferation index (extent of division). The product of these two parameters is the division index. (C) The division index of each assay was then normalized to each Treg subset baseline (each 0:1 ratio), and expressed as a percentage. Comparisons were made using t-test of the area under the curve (AUC) for each subset (n=5).

