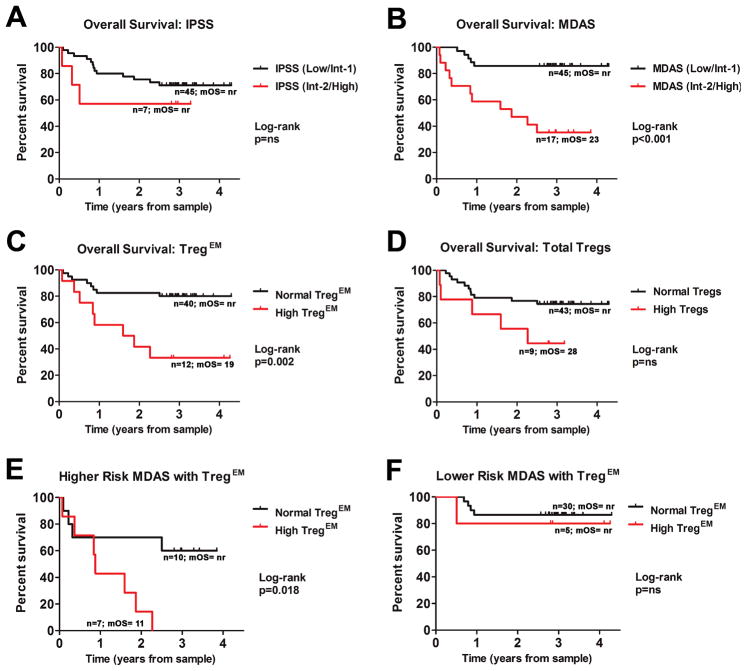
Figure 4. Reduced overall survival (OS) in MDS patients with high TregEM numbers.
OS data of 52 MDS patients was analyzed using the Log-rank method and visualized using Kaplan-Meier plots as stratified by IPSS (A), MDAS (B), by TregEM numbers (C) and by total Treg numbers (D). OS was also analyzed between patients stratified by normal or high TregEM cell numbers in regard to higher-risk (E) and lower-risk (F) MDAS. ns = not significant. mOS= median overall survival (months). nr= not reached.

