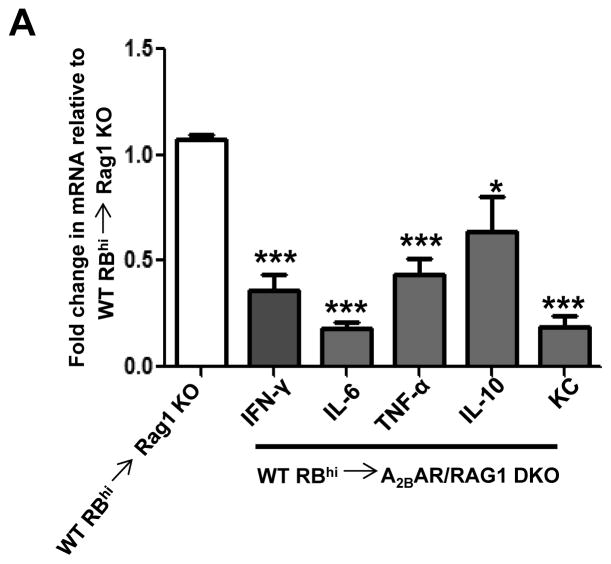
Figure 4. T-cell mediated pro-inflammatory cytokine production is attenuated in the absence of A2BAR.
Real-time PCR was utilized to determine the mRNA levels of the listed cytokines in the colons of RAG1 KO and A2BAR/RAG1 DKO mice 7–8 weeks after T-cell transfer. RAG1 KO cytokine levels were normalized to 1.0 and the A2BAR/RAG1 DKO cytokine levels represent the fold-change compared to RAG1 KO cytokine levels. 36B4 was used as an internal control to account for variances in cDNA used in each real-time PCR reaction. Statistical significance was assessed using Students t-test, where ***, p < .001 and *, p < .05 (IL-10 only) when compared to RAG1 KO cytokine levels, which were normalized to 1.0. 6 mice were used for each experimental group and error bars represent standard deviation.

