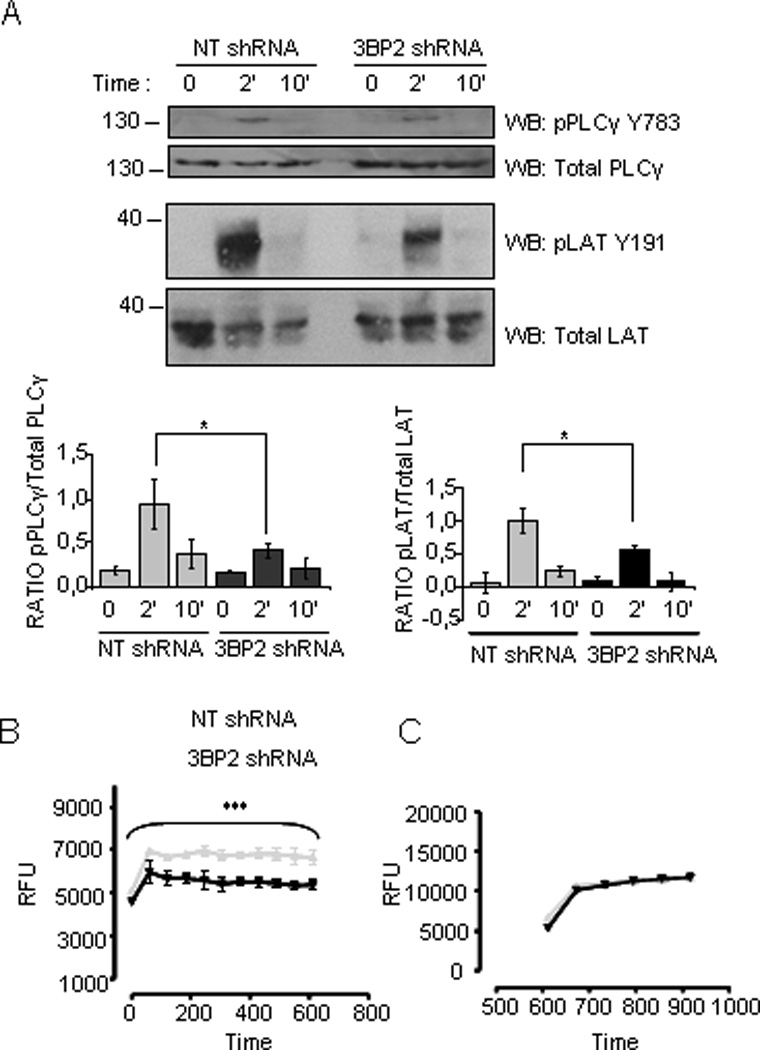
Figure 5. FcεRI-mediated phosphorylation of PLCγ and LAT and resulting calcium signal are reduced in 3BP2 shRNA- silenced cells.

Specific anti-phosphorylated LATY191 and PLCγ Y783 antibodies were used to blot membranes with 3BP2 knockdown versus control shRNA huMCs cell lysates upon biotinylated IgE crosslinking with 100ng/ml SA for various times as indicated. Densitometric analysis and phosphorylated/total ratio for each molecule from 3 independent experiments is represented in the bar charts next to the blot (A). Calcium fluxes following FcεRI stimulation were measured in biotinylated IgE sensitized 3BP2 shRNA silenced and NT shRNA transduced LAD2 (B) cells loaded with Fluo4. Cells were stimulated with 100 ng/ml streptavidin (SA) and analyzed by fluorimetric measure of free calcium concentrations. Results are expressed as mean +/− SD of triplicates and it is representive of 6 independent experiments. 3BP2 shRNA and NT shRNA transduced LAD2 cells responses to ionomycin, respectively are shown in (C). Statistical significance (*p< 0.005, ***p< 0.0001) is relative to NT shRNA. RFU means relative fluorescence units.
