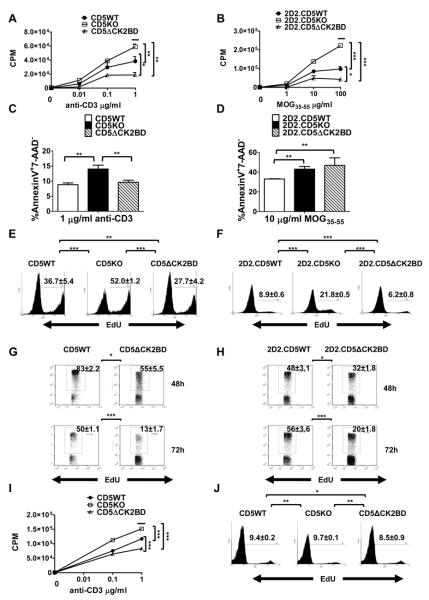
FIGURE 4.
CD5ΔCK2BD T-cells hypoproliferate and exhibit increased AICD. Proliferation of CD4+ T-cells following 72 h stimulation with anti-CD3 (A) or MOG35-55 peptide (B) in the presence of Thy 1.2+ cell-depleted splenocytes serving as APCs as measured by the [3H]thymidine incorporation assay. [3H]thymidine was added for the final 18 h of culture. Data ± SEM are from a representative experiment with n =2-3 experiments and 2-3 mice per experiment. C and D, Frequency of early apoptotic events (AnnexinV+7-AAD−) following 24 h of stimulation with anti-CD3 (C) or MOG35-55 peptide (D). Data± SEM are the average from n =3 experiments and 2-3 mice per experiment. E and F, Frequencies of CD4+ T-cells in cell cycle measured by the EdU incorporation assay after stimulation with anti-CD3 (E) or MOG35-55 peptide (F). G and H, Frequencies of CD4+ T-cells in cell cycle in co-cultures of G, CFSE-labeled CD5WT and unlabeled CD5ΔCK2BD CD4+ T-cells stimulated with anti-CD3 mAb or H, CFSE-labeled 2D2.CD5WT and unlableled 2D2.CD5ΔCK2BD T-cells stimulated with MOG35-55 peptide for the indicated time periods. In E, F, G, and H, the cells were pulse labeled with EdU for 1 h prior to analysis. Data ± SEM represent the average of 2-3 mice per group per experiment, n= at least 3 experiments. I and J, Proliferation of CD8+ T-cells measured by the [3H]thymidine incorporation assay (I) or EdU incorporation (J). Purified CD8+ T-cells were stimulated with varying concentrations of anti-CD3 for 72 h. The [3H]thymidine incorporation assay and EdU incorporation assay were performed as described above for CD4+ T-cells. Data ± SEM represent the average of 3 mice per group per experiment, n= 3 experiments. Bars above plots denote regions of statistical significance. *p<0.05, **p<0.01, ***p<0.001 with Student t test. EdU, 5-ethynyl-2′-deoxyuridine.

