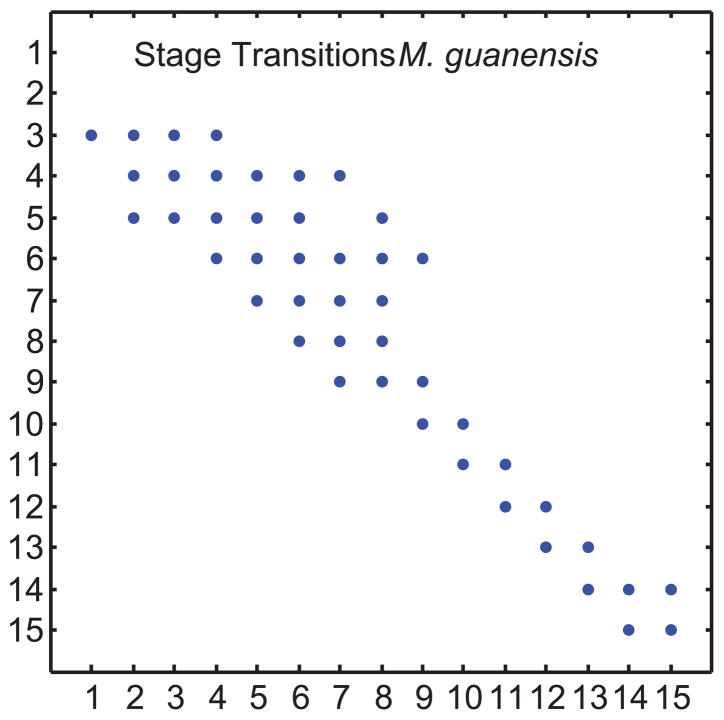
Figure 5.
Stage transition probabilities t(i, j) for the treelet Myrsine guianensis. Stage 1= seedlings, stage 2= suckers, stage 3–15 = size classes. Stasis is given by the t(i, i) elements, transitions above the diagonal describe regression, transitions below describe growth. For more details of stages see the Appendix.

