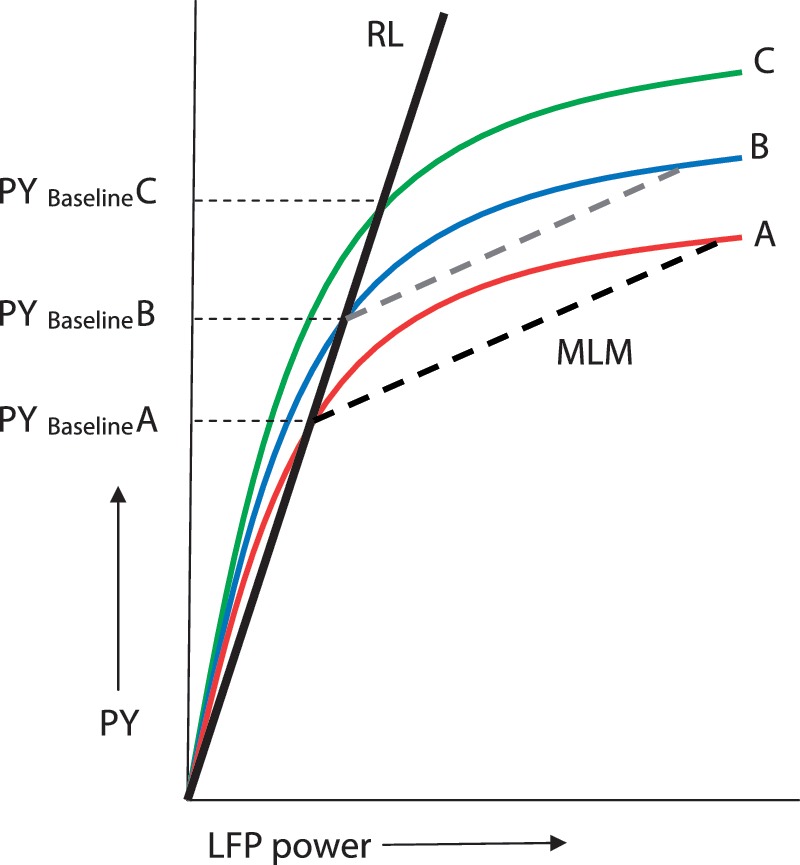
Figure 1.

Putative relationship between frequency-specific LFP power and peak yank (PY), shown for three hypothetical individuals (Cases A, B and C). The continuous black line labelled ‘RL’ is the regression line fitting the LFP power relationship with peak yank, under baseline conditions (response to visual cues, when patients ON l-DOPA), across subjects. The interrupted black line, labelled ‘MLM’ is estimated by multi-level modelling on the basis of experimental condition-specific regression coefficients between frequency-specific LFPs and peak yank, corrected to each individual’s baseline performance. It thus models ‘within-subject’ effects of experimental manipulations from standard conditions. An average experimental condition-specific intercept shift of the MLM line from baseline would implicate increments or decrements in motor performance independent of frequency-specific subthalamic nucleus LFP power. Such an average shift would equate to the shift of curve A to curve B, whilst maintaining the gradient of the MLM line (translation of interrupted black line to the position of the interrupted grey line).
