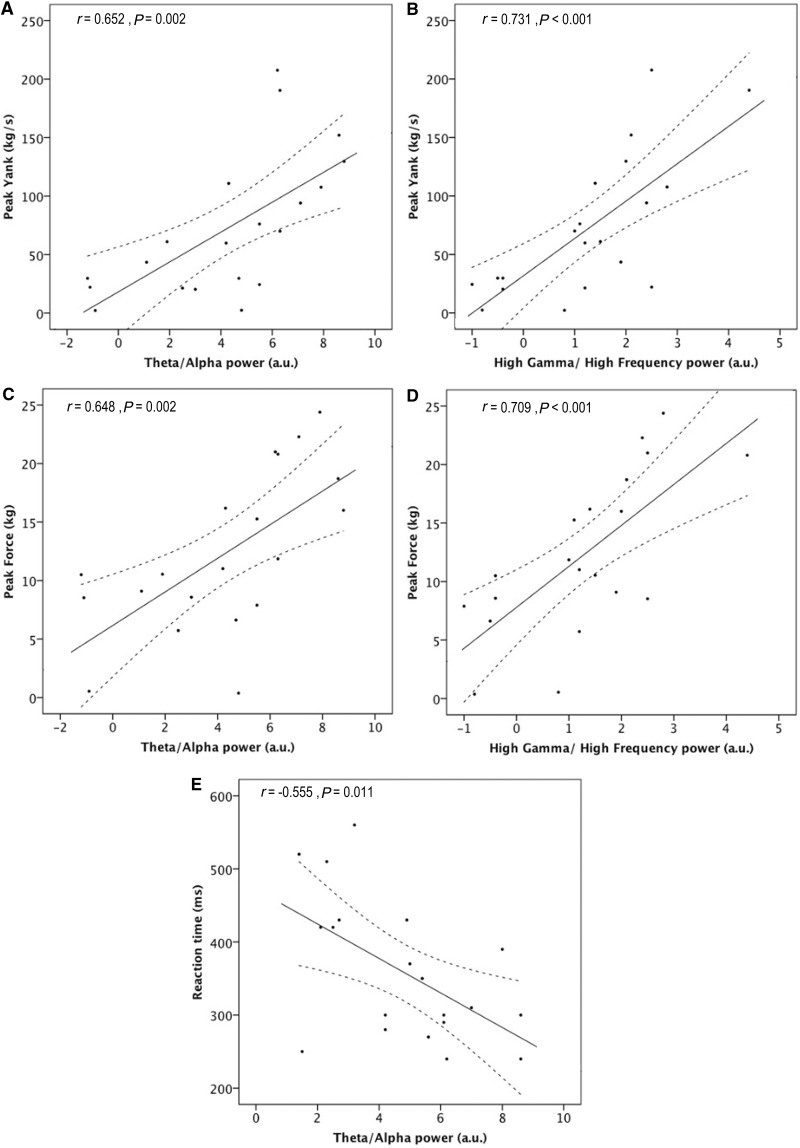
Figure 4.
Scatter-graphs relating LFP power to performance. Continuous and interrupted lines represent the best fit and corresponding 95% confidence limits estimated by linear regression. Significant correlations with peak yank, peak force and reaction time were found in the theta/alpha (5–12 Hz) band, and with peak yank and peak force in the high-gamma/high-frequency (55–375 Hz) range. No correlations were found in the beta (13–30 Hz) band. Non-significant correlations are not illustrated.

