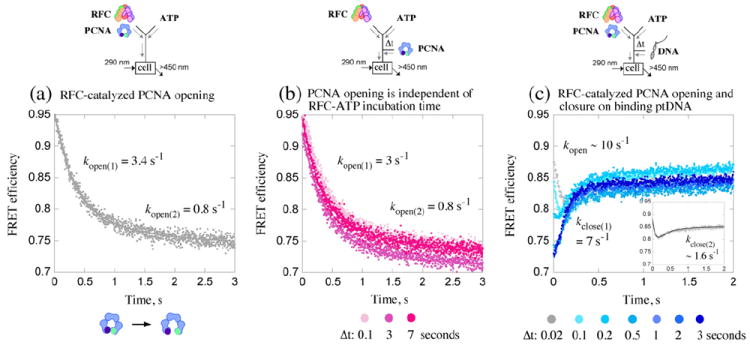
Fig. 2.

Kinetics of PCNA opening and closure around DNA. Opening/closing of PCNA clamp is measured by change in FRET between tryptophan (donor; λEX=290 nm) and AEDANS (acceptor; λEM>450 nm) at the PCNA-WCAEDANS inter-subunit interface. (a) Rapid mixing of RFC and PCNA with ATP results in FRET efficiency decrease as PCNA opens; 2-exponential fit of the data yields kopen(1)=3.4 s−1 and kopen(2)=0.8 s−1. (b) Pre-incubation of RFC with ATP (Δt=0.02–10 s; 0.02, 3, 7 s shown) prior to addition of PCNA does not alter the apparent PCNA opening rates. (c) Pre-incubation of RFC and PCNA with ATP (Δt=0.02–3 s) followed by addition of ptDNA results in FRET efficiency increase as PCNA closes (around DNA). At shorter Δt (e.g., 0.02 s; gray trace), only a fraction of PCNA has been opened, and both clamp opening (FRET decrease) and closing (biphasic FRET increase) are detected after ptDNA addition (see inset); 3-exponential fit of the data yields kopen=10 s−1, kclose(1)=7 s−1, and kclose(2)=1.6 s−1. At longer Δt (e.g., 3 s; dark-blue trace), all PCNA is open, and only clamp closing is detected at kclose(1)=7 s−1. Final reactant concentrations: 0.6 μM RFC, 0.25 μM PCNA, 0.25 μM ptDNA (when present), and 0.5 mM ATP. Rate constants obtained from the analytical fits were utilized as initial estimates for global data analysis.
