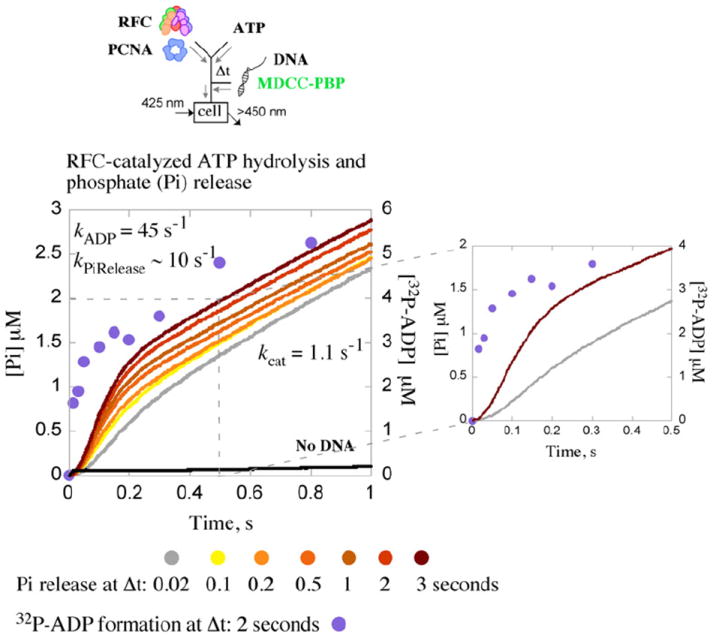
Fig. 4.

Kinetics of ATP hydrolysis and phosphate (Pi) release. RFC-catalyzed Pi release is measured by change in fluorescence intensity of MDCC-PBP. Pre-incubation of RFC and PCNA with ATP (Δt=0.02–3 s) followed by addition of ptDNA results in a burst of Pi release followed by a linear steady-state phase; the burst amplitude increases with Δt, indicating slow step(s) in the reaction preceding ATP hydrolysis and Pi release. Additionally, a lag prior to the Pi burst phase (even at Δt=3 s), not seen for [α 32P]ADP formation ([α 32P]ADP data shown in purple for Δt=2 s),20 indicates slow step(s) between ATP hydrolysis and Pi release (see expanded view). An exponential+linear fit of the Δt=2 s ADP data yields a burst rate of kADP=45 s− 1 and steady-state kcat=1.2 s−1 (slope/3×[RFC]); similar analysis of the Δt=3 s Pi release data yields kPiRelease=10 s−1 and kcat=1.1 s−1. Final reactant concentrations: 1 μM ([32P]ATPase) or 0.5 μM (Pi release) RFC, 2.5 μM ([32P]ATPase) or 1 μM PCNA (Pi release), 2.5 μM ptDNA, 0.5 mM ATP, and 10 μM MDCC-PBP (Pi release). Rate constants obtained from the analytical fits were utilized as initial estimates for global data analysis.
