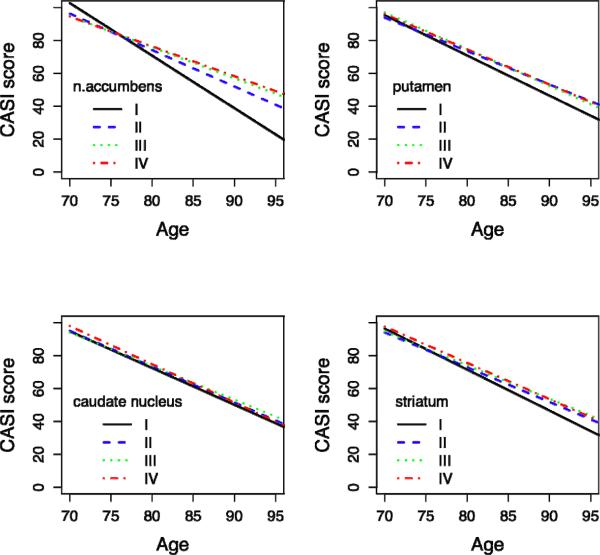
Figure 2. Predicted CASI-score over time per quartile of striatal volume.
X-axis: Age = Age of observation
Y-axis: CASI Score = Predicted mean CASI (Cognitive Ability Screening Instrument) score over 8-year interval, adjusted for age, age at baseline, educational level, ICV, CES-D score, lacunes grade, presence of cerebral infarcts, WMH grade, bi-frontal distance/innertable distance, ApoE 4 allele, hippocampal volume quartiles.
Spaghetti plots of a random sample of 10 subjects per striatal volume quartile are displayed.

