Figure 3.
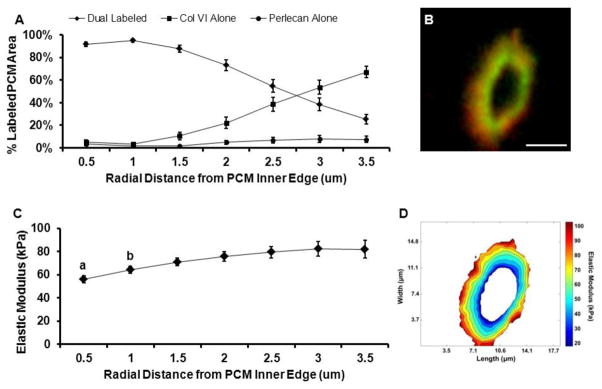
Spatial distribution of PCM biochemical composition and micromechanical properties from the PCM inner edge. Evaluation was performed at radial increments of 0.5 μm. (A) Outward progression of PCM biochemical composition. Within each radial increment, data represent the relative composition based on the percent of total IF labeled PCM area occupied by each antibody/antibody combination. (B) Representative IF labeling demonstrating co-localization of type VI collagen (red) and perlecan (green) within the PCM. Scale bar = 5 μm. (C) Outward stiffness progression of PCM elastic moduli. Elastic moduli within 1.0 μm from the PCM inner edge were less than moduli in peripheral regions (a: p < 0.05 as compared to distances greater than 1.5 μm; b: p < 0.05 as compared to distances greater than 2.5 μm). (D) Contour map of calculated elastic moduli within the PCM scan region shown in panel B. Data presented as Mean ± SEM (n = 23).

