
Figure 6.
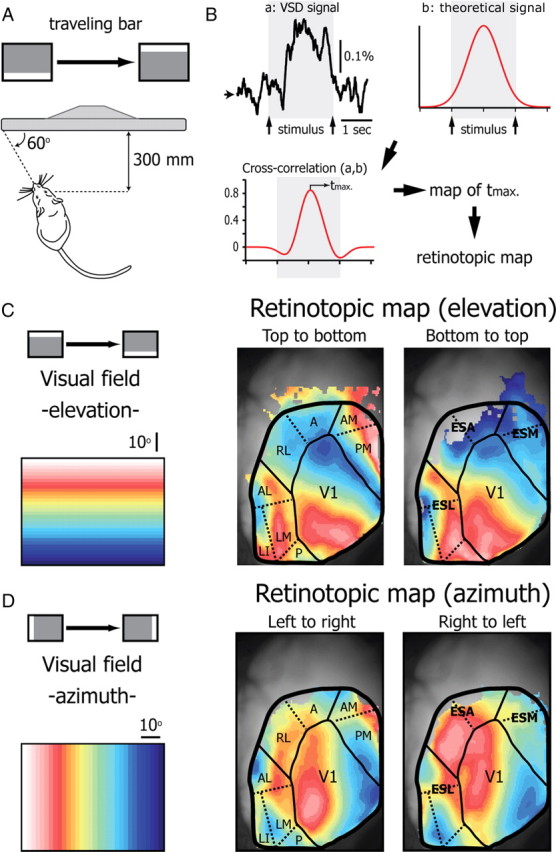
Retinotopy of the primary visual cortex and the extrastriate areas determined with VSD imaging. A, Schematic representation of the experimental setup. Bars (4 different directions) traveling across the screen in 2 s were presented to the eye contralateral to the imaged cortex. B, Construction of the retinotopic maps. For each direction the response of pixels is averaged over 50 trials (a: VSD signal). For each pixel, the time of activation is defined as the time at which the cross-correlogram (cross-correlation a,b) between the VSD signal of the pixel (a: VSD signal) and a Gaussian curve reference (b: reference) reaches its maximum (tmax). Color maps (presented in C and D) are created by assigning to each pixel its tmax value. C, Retinotopic maps of the elevation calculated using the VSD signal evoked by a horizontal bar crossing the screen from top to bottom (left map) or from bottom to top (right map). Color code of the elevation is indicated on the left. D, Retinotopic map of the azimuth calculated using the VSD signal evoked by a vertical bar crossing the screen from left to right (left map) or from right to left (right map). The boundaries of V1, ESL, ESA, and ESM are delimited by solid lines. Dotted lines highlight distinct retinotopically organized extrastriate areas described anatomically by Wang and Burkhalter (2007). A, anterior area; AL, anterolateral area; AM, anteromedial area; LI, laterointermediate area; LM, lateromedial area; P, posterior area; PM, posteromedial area; RL, rostrolateral area.