Figure 7.
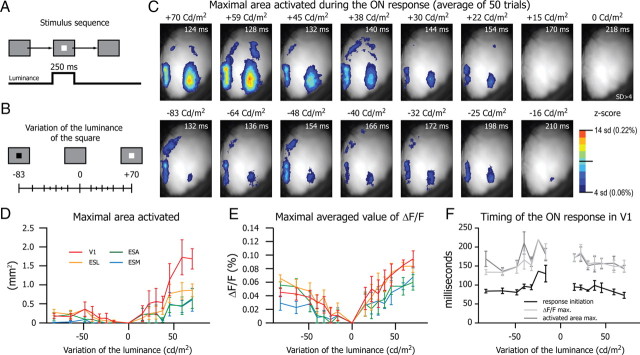
Properties of the evoked response as a function of the stimulus intensity. A, Stimulus sequence, A bright square of 18 × 18° is flashed for 250 ms on a gray background (83 Cd/m2). B, The contrast between the luminance of the square and the background could take 15 values ranging from −83 Cd/m2 to +70 Cd/m2. C, Single frames (average of 50 trials) corresponding to the maximal area activated in V1 during the ON response. ΔF/F is expressed as z-score (scale on the bottom right). For each contrast (indicated above each frame) this maximal activation occurred after the delay indicated on the top right corner of the image. D, Plot of the maximal surface activated (threshold 2 baseline SD) during the ON response for V1, ESL, ESM, and ESA (n = 6). E, Maximum values of the ΔF/F in the four functional regions of the visual cortex (n = 6). F, Delay between the stimulus onset and the response initiation (black trace), the ΔF/Fmax (light gray), and the maximal activated area (activated area max., dark gray) in the V1 as a function of the stimulus contrast.

