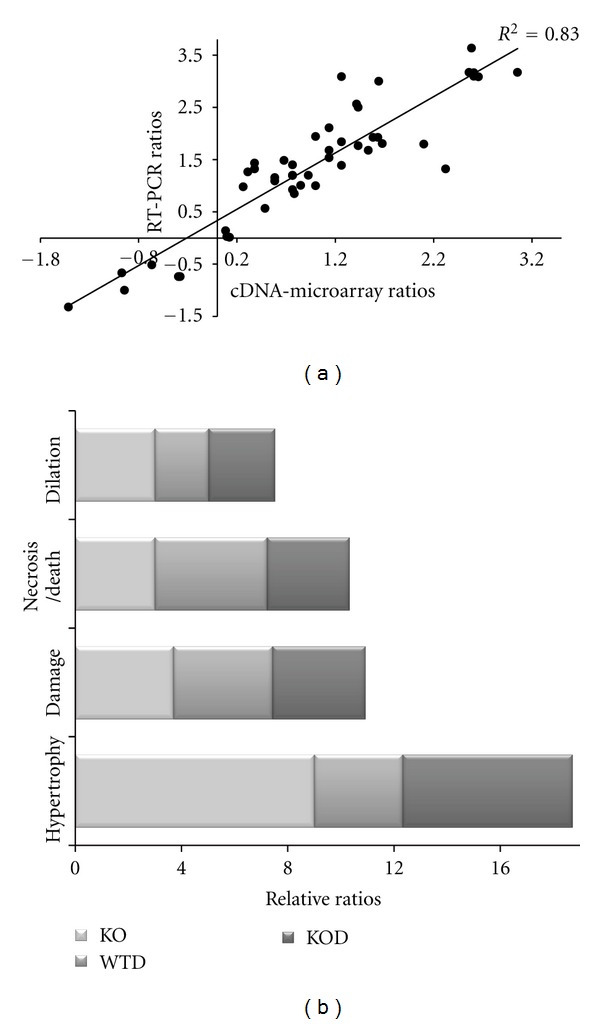
Figure 3.

Validation of cDNA microarray ratios and functional clustering. The cDNA array ratios were correlated to RT-PCR ratios of differentially expressed genes. (a) Following logarithmic transformation, RT-PCR ratios were plotted against cDNA array ratios. (b) Differentially expressed genes among erbB4-KO, WTD, and erbB4-KOD hearts using the criteria of FDR < 10 were enriched in GO terms and functionally clustered. The graphics represent top groups enriched in number of genes and expression fold change corresponding to cardiac disorders for KO, WTD, and KOD hearts relative to WT.
