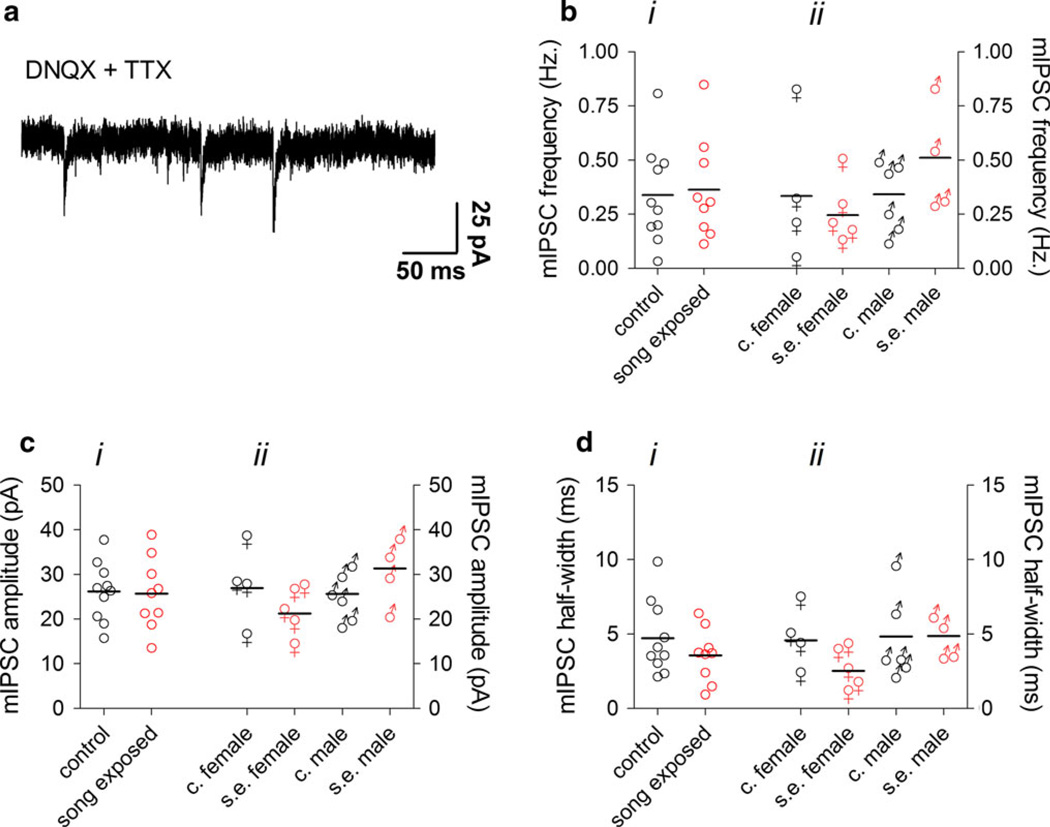
Fig. 3.
Miniature GABAergic synaptic currents in the NCM are not affected by song exposure. a Representative recording of mIPSCs in the presence of TTX. b i mIPSC frequency in the NCM of control and song-exposed birds (control: 0.34 ± 0.07 Hz, n = 10; song-exposed: 0.37 ± 0.08 Hz, n = 9). b ii sIPSC frequency in the NCM of control and song-exposed birds segregated by gender (control females: 0.33 ± 0.2 Hz, n = 4; song-exposed females: 0.24 ± 0.06 Hz, n = 5; control males: 0.3 ± 0.2 Hz, n = 6; song-exposed males: 0.5 ± 0.1 Hz, n = 4). c i mIPSC amplitude in the NCM of control and song-exposed birds (control: 26.2 ± 2.1 pA, n = 10; song-exposed: 25.7 ± 2.7 pA, n = 9). c ii sIPSC amplitude in the NCM of control and song-exposed birds segregated by gender (control females: 27 ± 4 pA, n = 4; song-exposed females: 21.2 ± 2 pA, n = 5; control males: 25.7 ± 2 pA, n = 6; song-exposed males: 31.3 ± 4 pA, n = 4). d i mIPSC half width in the NCM of control and song-exposed birds (control: 4.7 ± 0.8 ms, n = 10; song-exposed: 3.6 ± 0.6 ms, n = 9). d ii mIPSC half width in the NCM of control and song-exposed birds segregated by gender (control females: 4.6 ± 1 ms, n = 4; song-exposed females: 2.5 ± 0.6 ms, n = 5; control males: 4.8 ± 1 ms, n = 6; song-exposed males: 4.8 ± 0.6 pA, n = 4). Values above correspond to the mean ± SEM; on the graphs, each symbol corresponds to a value of a single neuron and the horizontal line represents the mean

