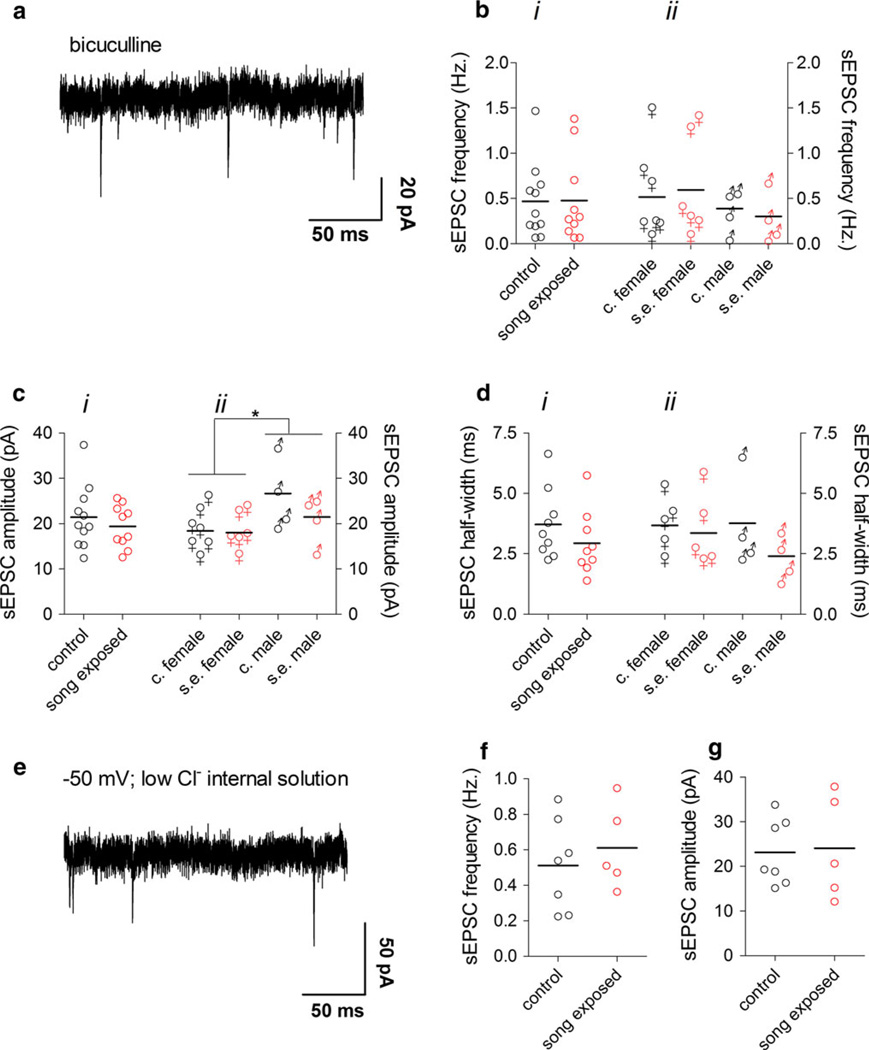
Fig. 4.
Spontaneous glutamatergic synaptic currents in the NCM are not affected by song exposure. a Representative sEPSCs recorded at −70 mV using a high-chloride internal solution in the presence of bicuculline. b i sEPSC frequency in the NCM of control and song-exposed birds (control: 0.46 ± 0.12 Hz, n = 11; song-exposed: 0.48 ± 0.15 Hz, n = 10). b ii sEPSC frequency in the NCM of control and song-exposed birds segregated by gender (control females: 0.5 ± 0.2 Hz, n = 7; song-exposed females: 0.6 ± 0.2 Hz, n = 6; control males: 0.4 ± 0.2 Hz, n = 4; song-exposed males: 0.3 ± 0.1 Hz, n = 4). c i sEPSC amplitude in the NCM of control and song-exposed birds (control: 21.4 ± 2.1 pA, n = 11; song-exposed: 19.4 ± 1.5 pA, n = 10). c ii sEPSC amplitude in the NCM of control and song-exposed birds segregated by gender (control females: 18.4 ± 1.8 pA, n = 7; song-exposed females: 18.01 ± 1.7 pA, n = 6; control males: 26.7 ± 3.9 pA, n = 4; song-exposed males: 21.5 ± 3 pA, n = 4; *p < 0.05). d i sEPSC half width in the NCM of control and song-exposed birds (control: 3.7 ± 0.5 ms, n = 9; song-exposed: 2.9 ± 0.4 ms, n = 9). d ii sEPSC half width in the NCM of control and song-exposed birds segregated by gender (control females: 3.7 ± 0.5 ms, n = 5; song-exposed females: 3.3 ± 0.7 ms, n = 5; control males: 3.8 ± 1 ms, n = 4; song-exposed males: 2.4 ± 0.5 ms, n = 4). e Representative recording of sEPSCs recorded at −50 mV using a low-chloride internal solution. f sEPSC frequency measured at −50 mV in a low-chloride internal solution (control: 0.5 ± 0.1 Hz, n = 7; song-exposed: 0.6 ± 0.1 Hz, n = 5). g sEPSC amplitude measured at −50 mV in a low-chloride internal solution (control: 23.1 ± 3 pA, n = 7; song-exposed: 24.08 ± 5 pA, n = 5;). Data in e–g were from male birds. Values above correspond to the mean ± SEM; on the graphs, each symbol corresponds to a value of a single neuron and the horizontal line represents the mean

