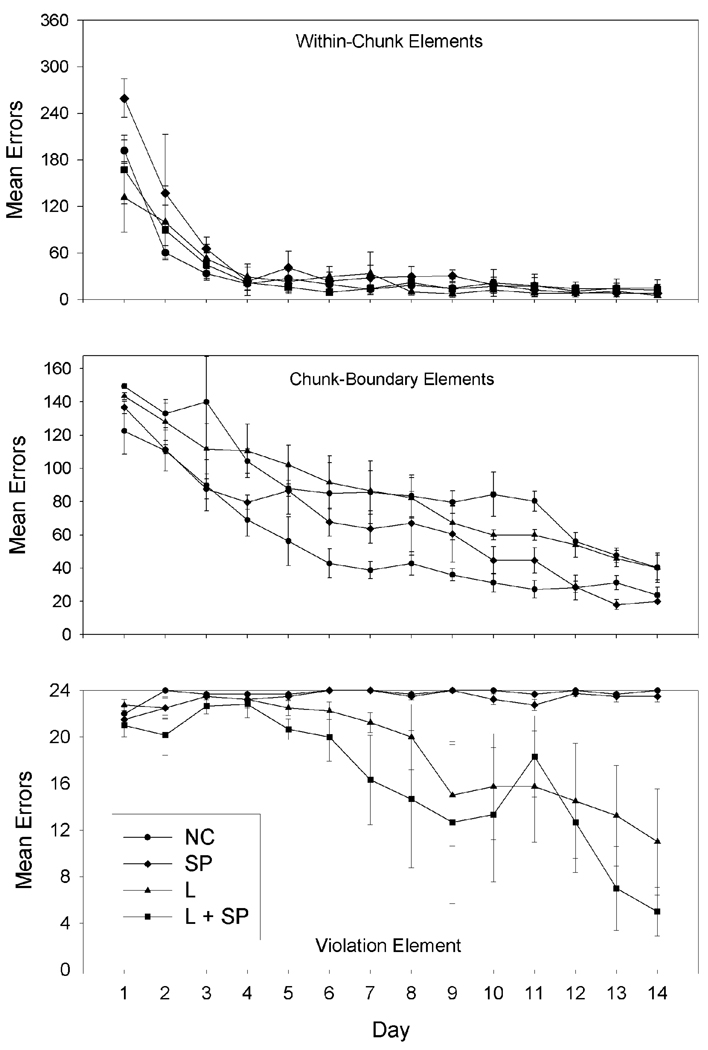
Figure 1.
Acquisition curves for within-chunk elements (top panel), chunk-boundary elements (middle panel), and the violation element (bottom panel), respectively, for the first 14 days of Experiment 1 shown as day-by-day group mean errors for the Location (L), Serial Position (SP), Location and Serial Position (L+SP), and No Cues (NC) groups. Error bars: ± SEM.

