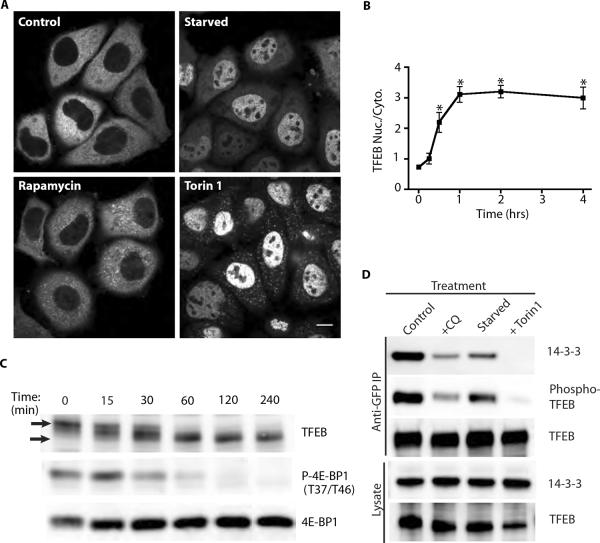
Fig. 3.
Regulation of TFEB by mTORC1. (A) Live cell imaging of TFEB-GFP following starvation (Earl's Buffered Saline Solution), rapamycin (200nM) and torin 1 (2μM) treatments (2 hours). (B) Timecourse of the changes in the nuclear to cytoplasmic ratio of TFEB-GFP that arise due to torin 1 (2μM) treatment (n=3 experiments, average of 321 cells/condition/experiment, *p<0.01, ANOVA with Bonferroni post-test). (C) Timecourse showing the change in the electrophoretic mobility of native TFEB of Hela cells treated with 2μM torin 1 for the indicated times. Arrows indicate the relative positions of the phosphorylated TFEB (t=0) and the dephosphorylated TFEB (t=60 and beyond). (D) Western blots of anti-GFP immunoprecipitations from TFEB-GFP expressing cells subjected to the indicated treatments.

