Figure 3.

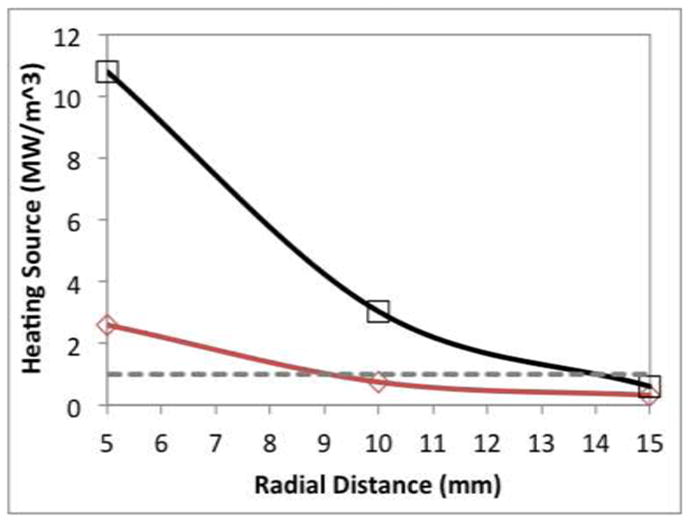
Heat source calculated at each position in normal liver. The dashed line indicates a theoretical heat loss of 1.0 MW/m3 associated with 1000 ml/kg/min blood perfusion.

Heat source calculated at each position in normal liver. The dashed line indicates a theoretical heat loss of 1.0 MW/m3 associated with 1000 ml/kg/min blood perfusion.