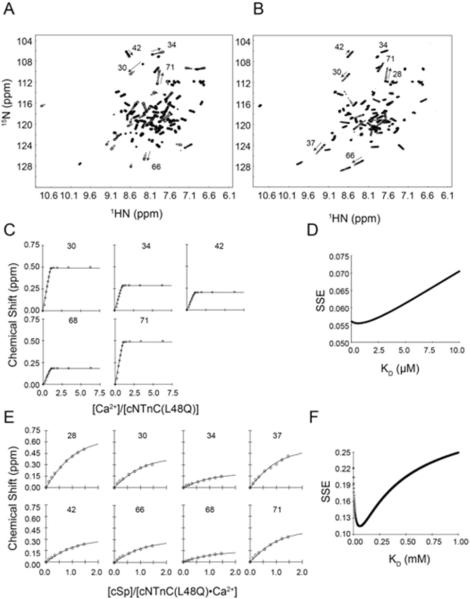
FIGURE 5.
1H,15N-HSQC spectra of A. the Ca2+ titration into Apo-cNTnC(L48Q) and B. the cTnI147-163 titration into cNTnC(L48Q)•Ca2+. C. Binding curves of the Ca2+ titration into cNTnC(L48Q) that were used in the global fit to determine the dissociation constant and D. the corresponding sum of squared error (SSE) for the global fit. E. Representative binding curves of the cTnI147-163 titration into cNTnC(L48Q)•Ca2+ that were used in the global fit to determine the dissociation constant and F. the corresponding SSE for the global fit.

