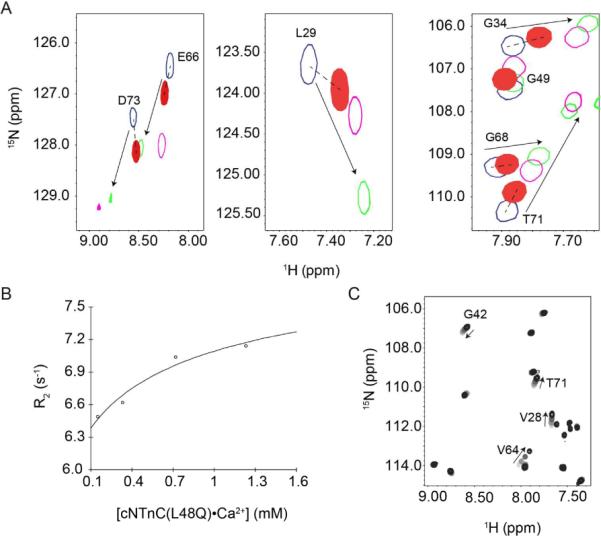
FIGURE 7.

Characterization of the conformation of cNTnC(L48Q)•Ca2+ by NMR. (A) Comparison of 1H,15N-HSQC spectra from cNTnC(L48Q)•Ca2+ (filled red) with cNTnC•Ca2+ (blue), cNTnC•Ca2+•cTnI147-163 (green) and cNTnC•Ca2+•bepridil (magenta). The resonances of cNTnC(L48Q)•Ca2+ are shifted intermediately between cNTnC(wt)•Ca2+ and the cTnI147-163 or bepridil bound forms of cNTnC. Dependence of the average 15N-T2 (B) and 1H,15N-HSQC (C) as a function of cNTnC(L48Q)•Ca2+ concentration. In the 1H,15N-HSQC spectrum, contours are colored from light grey to black as cNTnC(L48Q)•Ca2+ concentration increases. Several representative residues are labeled and arrows indicate the direction of chemical shift as concentration was increased.
