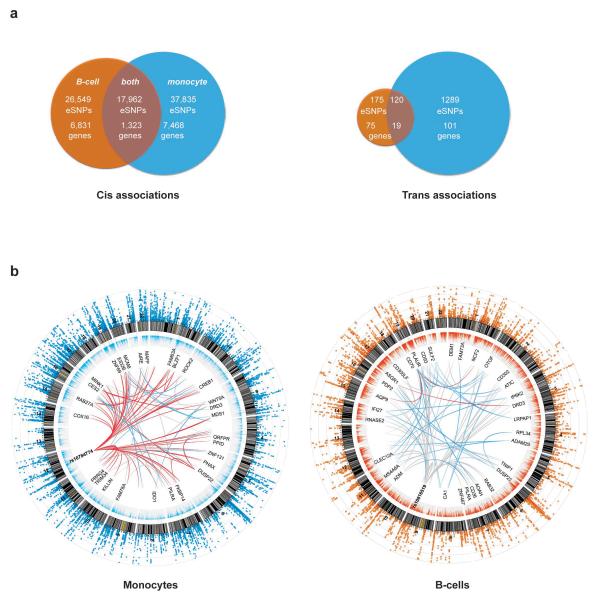
Figure 1. Shared and cell–specific cis and trans associations in B-cells and monocytes.
(a) Venn diagrams illustrating the number of eSNPs unique to each cell subset and shared between datasets in cis (left panel) and in trans. B-cell data depicted in orange, monocyte in blue. (b) Circos plots for monocyte dataset (left panel) and B-cell dataset. From outside rim inwards: The outermost rim depicts a Manhattan plot for eQTLs from the respective dataset, the second rim depicts relative expression of genes, the third rim depicts an arbitrary selection of genes (constrained due to space) with significant trans-eQTLs (p<1×10⁻¹¹) and the innermost network depicts ‘spokes’ between nodal eSNPs and their trans-regulated genes. Such nodal eSNPs include rs10784774 which marks a monocyte specific master-regulatory region while rs10816519 identifies a B-cell specific master regulatory region. Red spokes: > 10 eSNPs from this locus map to the trans-eQTLs, blue spokes: >1 and <10, grey spokes: 1 eSNP.

