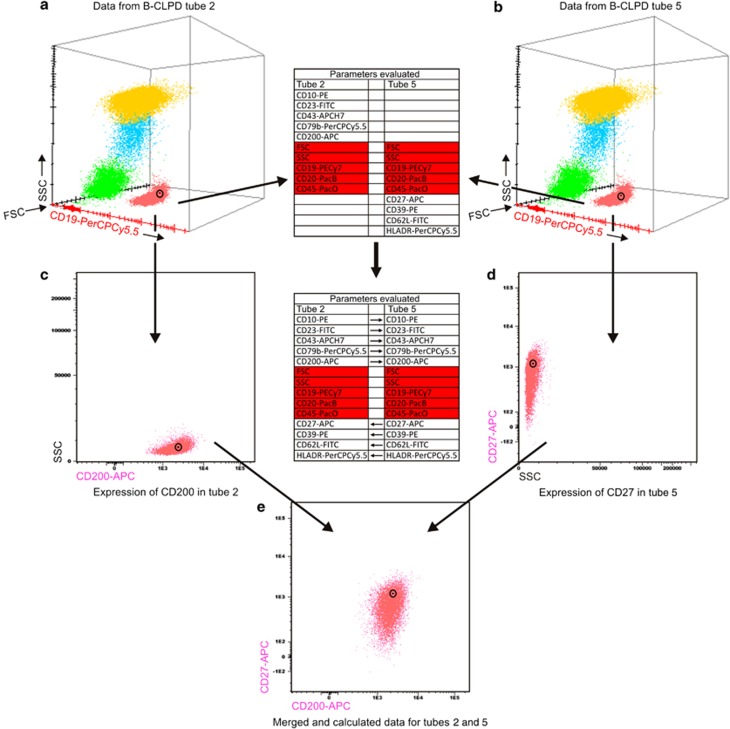
Figure 10.
Schematic representation of the data calculation process with the Infinicyt software based on the ‘nearest neighbor' principle. First, one event from a cell population (B-cells highlighted in red) in a is identified in a first data file (tube 2 of B-cell chronic lymphoproliferative disorders (B-CLPD) panel) based on the backbone markers; then the event corresponding to the nearest neighbor of this event is identified in the second data file (right; tube 5 of B-CLPD panel) as that event occupying the same (closest) position in a multidimensional space formed by the same backbone parameters (b). Third, through the data calculation process the values for those parameters that were only measured for the later event in the second data file (d) but not for the former event in the first data file are assigned to the said event in the first data file and vice versa (c). Finally, the calculation process is completed for all other events in the cell population of interest (red events). Through this approach, all events in the merged and calculated data file have information about each of the parameters measured in both tubes (e).

