
Figure 7.
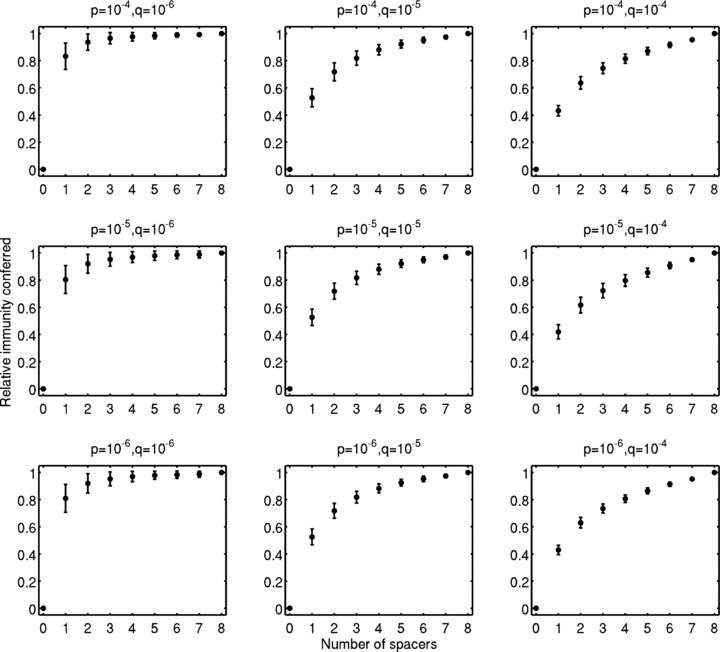
CRISPR Immunity is more influenced by changes in the host spacer acquisition rate (q) than stochastic failure of CRISPR immunity (p). Relative immunity conferred by the newest n spacers in the locus is compared to the immunity from the full locus of 8 spacers. Mean (circles) and standard deviation (error bars) were computed for all replicates averaged over the time points after the locus is filled with spacers. Immunity is determined by calculating what percentage of the viruses the most recent n spacers from all hosts can match, where n= 1, 2, …, 8. Relative immunity is the percentage of viruses the most recent n spacers from all hosts can match compared to the percentage of viruses the full spacer locus (in our case 8 spacers) matches. Values of p and q vary from 10−6 to 10−4. For all values of p, graphs for q= 10−4 include 25 replicates, graphs for q= 10−5 include 75 replicates, and graphs for q= 10−6 include 100 replicates.