
Fig. 4.
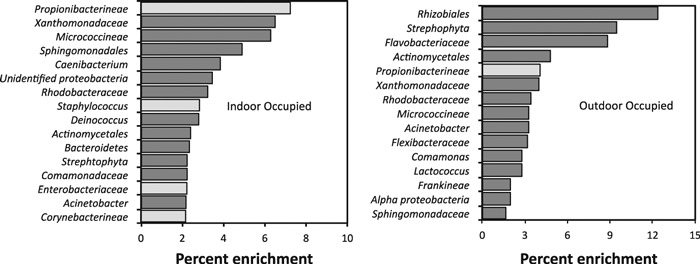
Bar chart demonstrates the relative abundances of the 15 most common bacterial taxa in the indoor occupied and outdoor occupied samples. Groups are classified to the highest taxonomic level to which they could be confidently assigned. Groups shown represent 57% of the occupied indoor air taxa and 68% of the outdoor air taxa. Those taxa that are associated with the human microbiome are presented in light gray