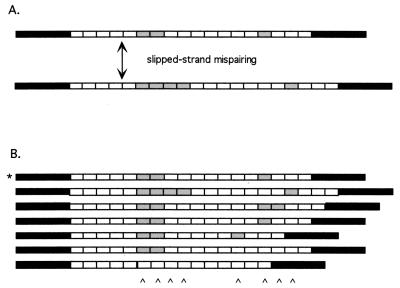
Figure 2.
A model of RAT evolution. Black boxes represent flanking single-copy regions; gray and white boxes represent different RATs. (A) A single slippage event yields a duplication of two gray RATs. (B) Six new alleles, derived from a single ancestor (indicated by *) after several cell generations. Slippage produces deletions as well as duplications. Karats at the bottom mark artifactual substitutions appearing when the alleles are aligned. Reprinted with permission from ref. 12.

