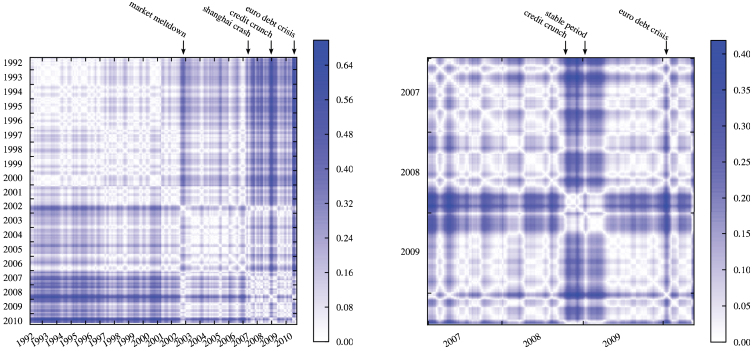
Figure 1. Financial crisis are accompanied by drastic changes in the correlation structure, indicated by blue shaded areas.
The market similarity ζ in the left panel is based on daily data. The right panel is a more detailed study of the 2007–2010 period, including the “credit crunch.” The area of the right panel is a magnification of the lower right square in the left panel.

