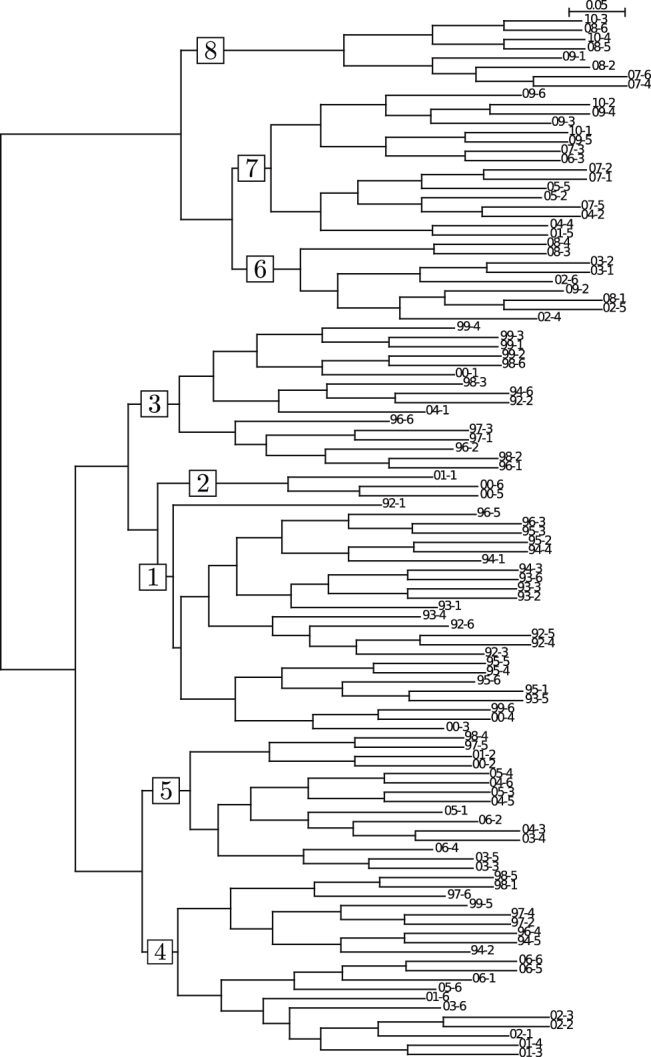
Figure 6. The entire tree of the clustering analysis presented here for the threshold 0: No termination of the division process takes place until all the correlation matrices are identified as different components.

The large bold numbers represent the market states each of which consists of the matrices in the sub-trees below. Each right end of the tree corresponds to each 2-month term (year-term). Terms 1, 2, …, 6 correspond to January to February, March to April, …, November to December, respectively. The length of each branch represents the distance from the center of the subcluster to the center of the original cluster before the last dual division.
