


Figure 2.
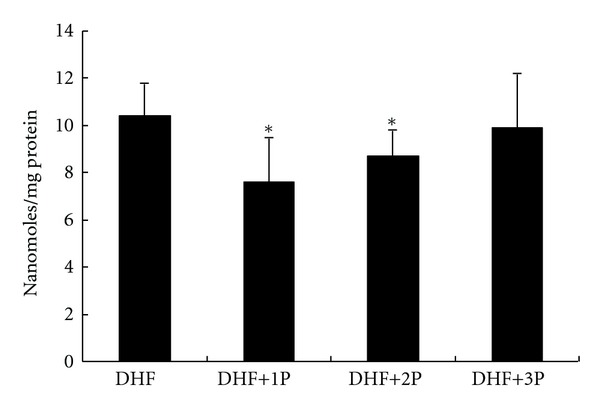
Polysaccharides (1P, 2P, and 3P) impact against lipid peroxidation (malondialdehyde (MDA) levels) in the liver of diabetic rats fed a high-fat diet (DHF). The ∗ indicates a significant difference compared to DHF group (P < 0.01).
Official websites use .gov
A
.gov website belongs to an official
government organization in the United States.
Secure .gov websites use HTTPS
A lock (
) or https:// means you've safely
connected to the .gov website. Share sensitive
information only on official, secure websites.
Polysaccharides (1P, 2P, and 3P) impact against lipid peroxidation (malondialdehyde (MDA) levels) in the liver of diabetic rats fed a high-fat diet (DHF). The ∗ indicates a significant difference compared to DHF group (P < 0.01).