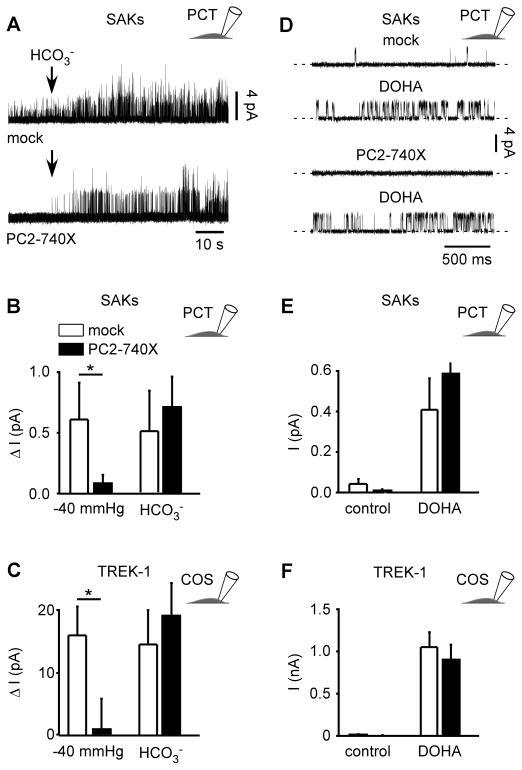
Figure 4. Stimulation of SAKs/TREK-1 activity by intracellular acidosis or DOHA is not altered by PC2-740X.
A) Addition of 90 mM HCO3− in the bath solution induced SAK activity in the cell-attached patch configuration at a holding potential of 0 mV in mock transfected PCT cells (top) or in PC2-740X transfected PCT cells (bottom). B) Changes in mean SAK current amplitude in mock (empty bars; n = 5) or PC2-740X (filled bars; n = 5) expressing PCT cells induced in the same patches by stretch (−40 mm Hg) or HCO3− addition (0 mm Hg). C) Changes in TREK-1 mean current amplitude in mock (empty bars; n = 28) or PC2-740X (filled bars; n = 21) co-expressing COS cells induced by HCO3− addition (0 mm Hg) or stretch (−40 mm Hg). D) Cell-attached patch recording of SAKs in a mock transfected PCT cell at a holding potential of 0 mV in control condition (0 mm Hg) including 0.01 % ethanol (vehicle; top trace) or after extracellular addition of 10 μM DOHA (second trace). Same with expression of PC2-740X (bottom two traces). E) Changes in mean SAK current amplitude (0 mm Hg) in the absence or in the presence of DOHA (10 μM) in PCT cells transfected either with a mock empty plasmid (empty bars; n = 8) or together with PC2-740X (black bars; n = 8). F) Changes in mean TREK-1 current amplitude (0 mm Hg) in the absence or in the presence of DOHA (10 μM) in co-expressing COS cells transfected either with a mock empty plasmid (empty bars; n = 12) or together with PC2-740X (black bars; n = 13). Data represent mean ± standard error of the mean.

