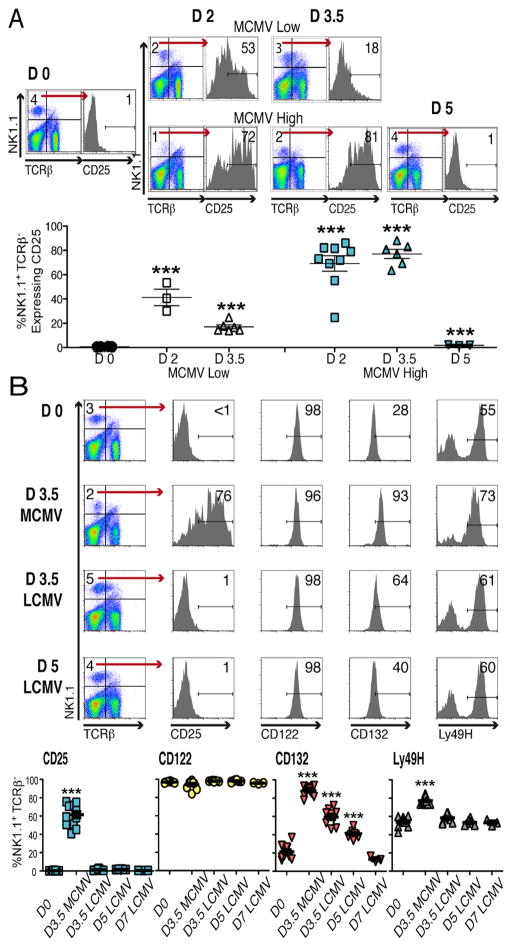
Figure 1. IL-2 receptor expression on NK cells.
Mice, B6, were infected with either 5,000 or 50,000 PFU of MCMV, or 4×10⁴ PFU of LCMV. Flow cytometry was used, identifying NK cells within total splenic leukocytes by gating on NK1.1+TCRβ − cells. (A) CD25 expression on D0, D2, D3.5 and D5 of low and high dose MCMV infections are shown. Representative samples from individual mice are given as flow plots. Composites, with data from 6 separate experiments, present symbols for results from individual mice. (B) Evaluated expression of CD25, CD122, CD132, along with the Ly49H activating molecules, is shown. Representative samples prepared from individual mice that were D0, D3.5 high dose MCMV infected, and D3.5 or D5 LCMV infected are given as flow plots. Composites, with data from 3 different experiments including the conditions shown along with studies of D7 LCMV infection, present symbols for results from individual mice. Total numbers of mice examined were from 10-to-13 with the exception of D5 LCMV with 8 and the D7 LCMV with 3. Means ± SE are shown as bars with error spread. P values ≤0.0001 are noted with ***.

