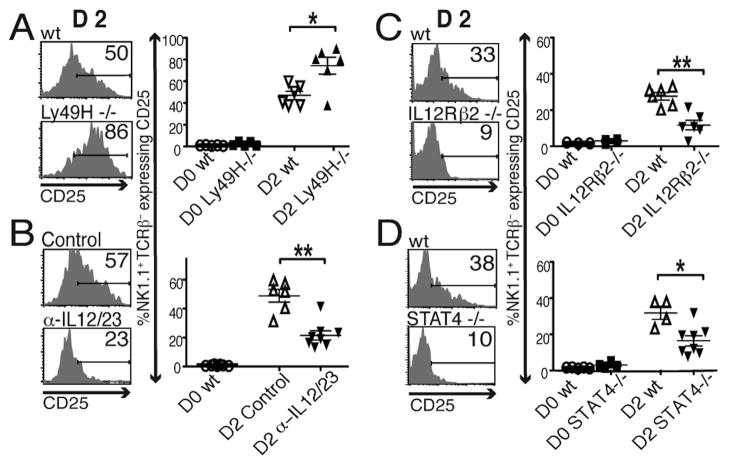
Figure 3. In vivo requirements for CD25 induction.
The expression of CD25 was evaluated, on NK1.1+TCRβ − NK cells, in mice at D0 and D2 of MCMV infection with 5,000 PFU. CD25 expression was compared on NK cells from wt and Ly49H−/− mice (A), from mice either receiving control Ab or α-IL-12/23 Ab at 4h before MCMV infection (B), from wt and IL-12Rβ2−/− mice (C), and from wt and STAT4−/− mice (D). Representative flow plots from individual mice are shown. Composites of results from individual animals are given on the right. Data for panels A, B, and C were assembled from 2 independent experiments with total mice examined on D2 being 6 to 8. The data for panel D are from 1 experiment with 5 to 8 mice per group. Statistically significant differences between groups are indicated (*p<0.01, **p<0.001).

