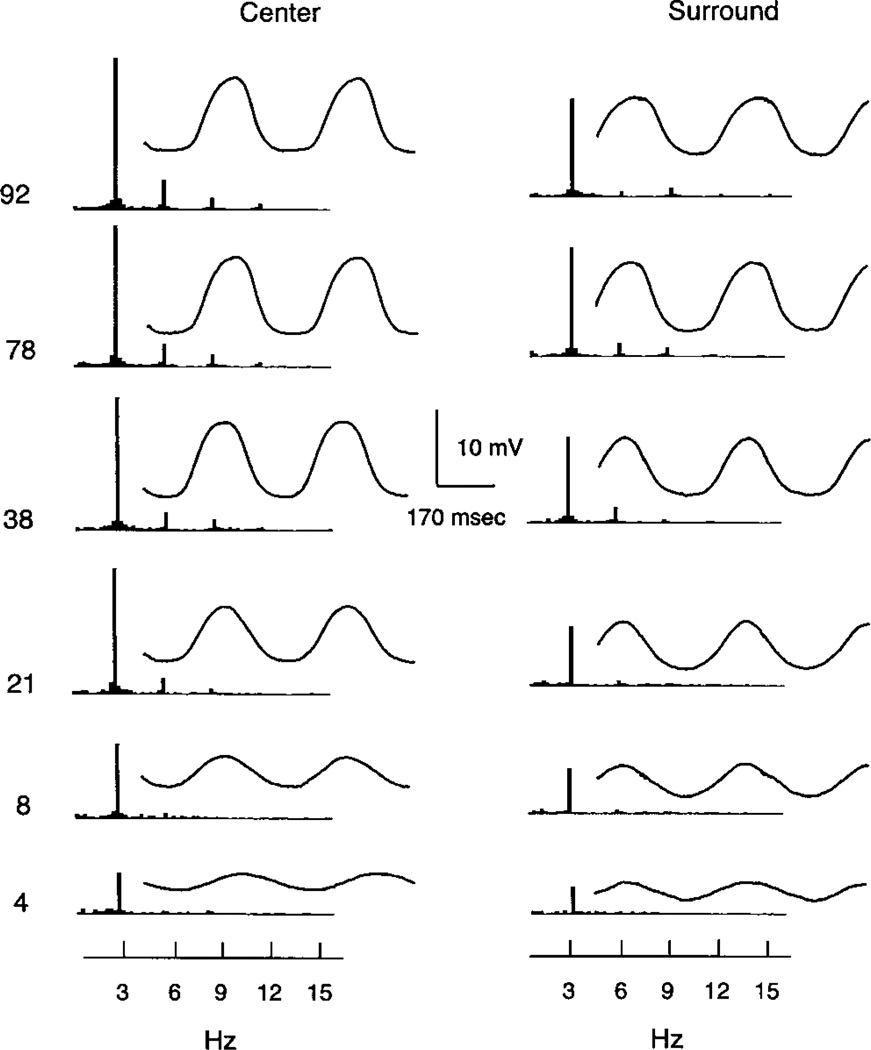
Fig. 2.
Signal averaged waveforms and Fourier spectra (FFT) for an ON bipolar cell to contrast modulations from 4 to 92%. The FFT is to the left of the average response waveform. The left column shows responses to a centered spot of 240 µm. The right column shows responses to a concentric annulus with an inner diameter of 382 µm and an outer diameter of 2000 µm.

