Figure 2.

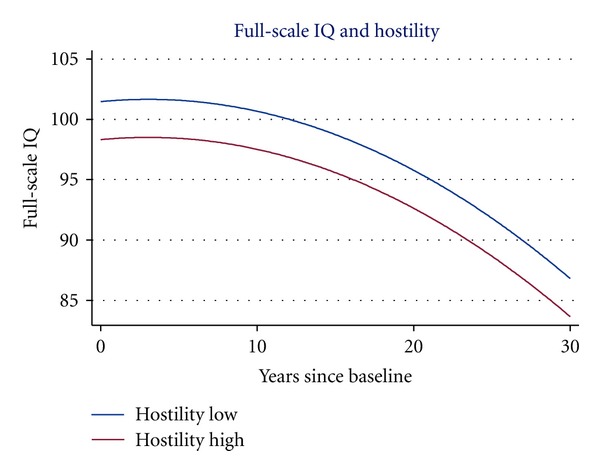
Hostility and decline in full-scale IQ age 50 to age 80. The curves correspond to 1 SD below and above the mean on the abbreviated Cook-Medley Hostility Scale. Adjusted for sex, education, and social status.

Hostility and decline in full-scale IQ age 50 to age 80. The curves correspond to 1 SD below and above the mean on the abbreviated Cook-Medley Hostility Scale. Adjusted for sex, education, and social status.