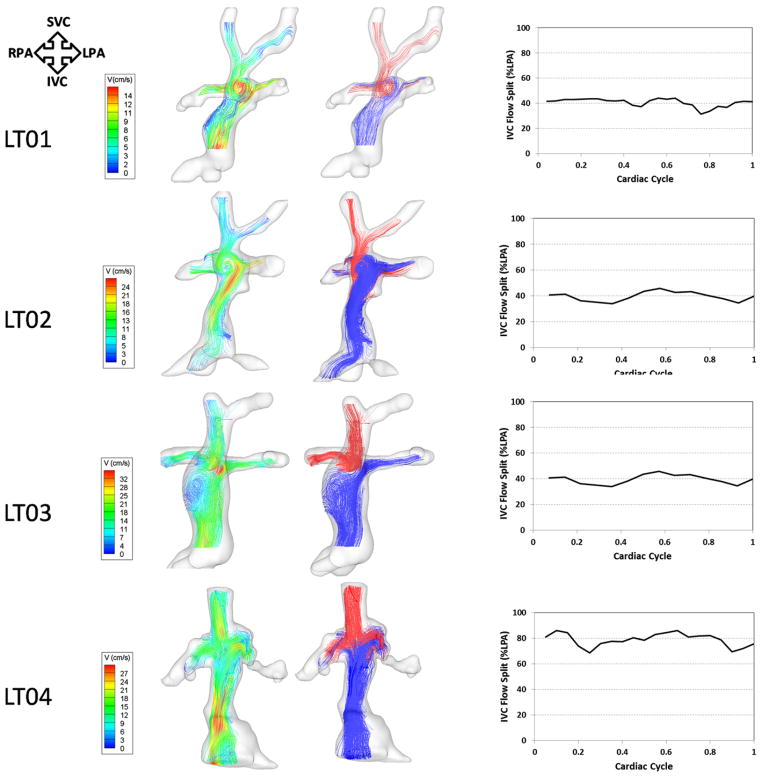
FIGURE 6.
Three-dimensional (3D) flow structures through 4 LT TCPC models with varying geometries. Left pane, Flow streamlines color-coded by velocity magnitude. Middle pane, Flow streamlines color-coded by their source of origin (SVC, red; IVC, blue). Right pane, Wave forms depicting varying IVC-LPA flow splits over the cardiac cycle. TCPC, Total cavopulmonary connection; LT, lateral tunnel; SVC, superior vena cava; IVC, inferior vena cava; RPA, right pulmonary artery; LPA, left pulmonary artery; V, velocity.

