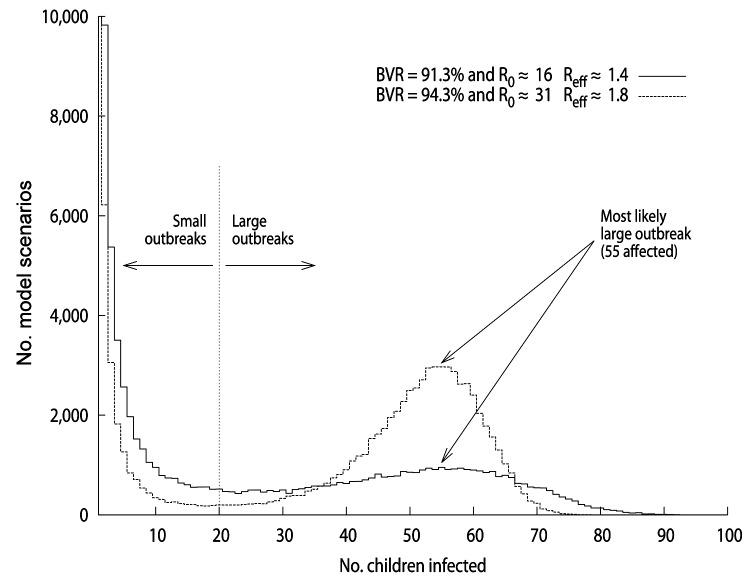
Figure 2.
Measles outbreak size histograms calculated with calibrated models. The y-axis indicates the number of model instances counted in their corresponding outbreak size histogram bin, indicated in the x-axis. The dotted line indicates the limit from which large and small outbreaks are defined. BVR, baseline vaccination ratio; R0, reproduction number, Reff, effective reproduction number.

